In the segmentation discussed in the previous two posts, as well as mean elevation, slope and aspect, I also have two curvature layers, longitudinal, and cross-sectional curvature that I calculated in
LandSerf. The definitions of these are explained in the
PhD thesis of Jo Wood, the author of LandSerf.
I thought to indicate longitudinal curvature using colour, shading convex slopes in red and concave in blue. Cross-sectional curvature is indicated with dots, which are white for diverging slopes and black for converging. Both of these are normalised by the square root of the segment area relative to the minimum segment area.
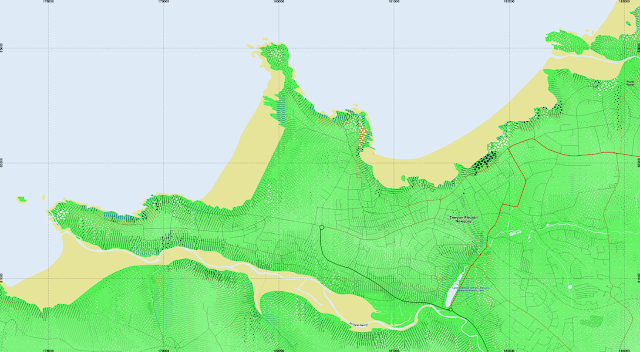 |
| Newquay in Cornwall. Convex slopes appear in red, concave in blue. |
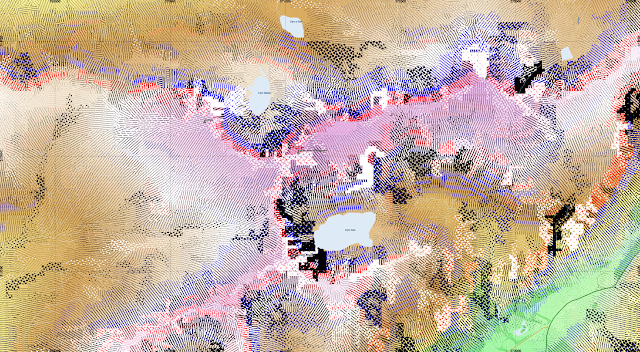 |
| Cadair Idris. Some strongly curved areas create very large dots that fill entire segments above Llyn Cau |
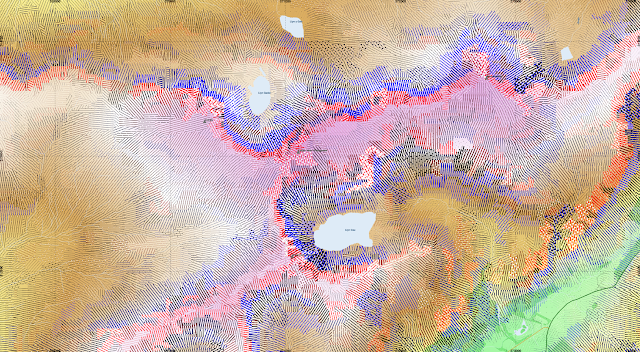 |
| Rescaling the dots to half their radius. |
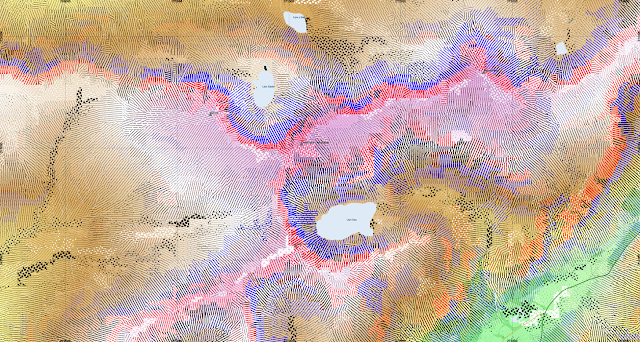 |
| Normalising the radius of the dots by the slope. i.e. reduce dots on steep slopes, and expand those on flatter terrain, such that they are scaled by the magnitude of the cross-sectional curvature relative to the slope. It does get a bit complicated, with the formula for their size in QGIS being "case when RAT_CrScCrv_Mean > 0 then 5*(90/max(RAT_slope_deg_Mean,1))*RAT_CrScCrv_Mean*(sqrt($area/(14*24*24))) else -5*(90/max(RAT_slope_deg_Mean,1))*RAT_CrScCrv_Mean*(sqrt($area/(14*24*24))) end" |


Complicated ? Darn right ! Not easy exactly to even read the resultant map ! :-)
ReplyDelete(Without understanding the maths in Jo Wood's paper at all - but obviously LandSerf is good, perhaps in a similar way to the geomorphons. Sounds a bit like if a customisation was needed for Cadair Idris, perhaps a global calibration routine, similar to what would've been handy for your Mars glaciers identifier, would be nice ?)
Really fine cartography as a result, very useful no doubt both for visualisation and for further data crunching.
It is only the visualisation that changes. I should really go back to the definitions of the curvature in the vector calculus, and have a think about what should really be measured. What comes out of the RSGISLib calculation is the elevation, slope, aspect, aspect from N, longitudinal and cross sectional curvatures averaged over the segment, which can be of variable size, so big segments would tend to have smaller averages because they average variation over a larger area. The problem I had that in certain areas of steep slope, such off the sides of the ridges around Cadair Idris, the numerical value of the cross-sectional curvature became relatively larger.
ReplyDeleteI thought to compensate for this, by changing the visualisation to make the dots smaller so they didn't fill the image. Now the problem with this is they effectively disappear in many other parts of the image, and it also isn't really satisfactory to just alter the visualisation by hand like that.
So I thought perhaps I should normalise by the slope, so that I would visualise the magnitude of the cross-sectional curvature (a second derivative) relative to the slope (first derivative), rather than simply the cross-sectional curvature itself. I also multiplied by the square root of the area, in an effort to compensate for the averaging of larger segments.
However, I think I have overdone it, because the average slope itself is already correlated to the segment size, the segment sizes tending to be smaller on steep slopes. Perhaps I should only divide it by slope and not do the sqrt(area) multiplication. I use area/14*24*24, because the cell size is 24*24m, and the minimum segment size (from RSGISlib) is 14 cells.