Saturday 27 December 2014

Using QGIS profiler plugin to compare 2m resolution LiDAR vs SRTM

I have an idea to produce an elevation aware cycling route planner, and the first step in that is to have some elevation data in the form of a Digital Terrain Model.

The most commonly used freely available digital elevation data is that derived from the Shuttle Radar Topography Mission. At the latitude of Cornwall (about 50 degrees N) it has a resolution of about 73m x 73m per cell.

There is however a possibility of getting LiDAR data (free for non-commercial use) from the UK Environment Agency, which has various resolutions, and I obtained some 2m resolution data for an area around Truro.

For a cycling route planner, it would be nice to be able to keep track of the smaller bumps that would be smoothed out by the SRTM data. However it might not be practical to use the high resolution data because once one considers larger areas the volume of data becomes very large indeed.

There is also the Terrain 50m raster data available through the Ordnance Survey website.

I wished to see what difference it would make on a simple test circular route in Truro. I chose one which starts off climbing a hill, then goes along relatively flat terrain and then back down the hill again by a different route.

The QGIS screenshot below shows using the "Profile Tool" QGIS plugin, where the darker shade of green is the lower elevation terrain. You may need to click on the image to view it in a larger format.

The actual profile itself showing the elevation as a function of distance along the path is as follows:

SRTM = red, OS Terrain50 = black, 2m LiDAR = green
 I have had an issue with the QGIS Profile tool, in that I can't currently get it to work from a saved track, rather than 'live' by point and click each time, therefore the 2nd image above is a slightly different path.


Unfortunately the LiDAR has some wildly oscillating values, particularly around 400m from start where the road is in a cutting near the top of Chapel Hill. I have therefore done a moving average smoothing to make them more comparable.
Although the OS Terrain 50m is a higher resolution dataset, it appears to have more artifacts than the SRTM which is ~73m at this latitude


Measuring total ascent, counting the total height gain considering only positive values:
Not a big difference in total ascent between SRTM and Terrain 50. I also made an estimate by inspection of a 1:25k OS map of 55m ascent.

The total ascents were 52m, 55m, 60m, and 75m respectively for the smoothed LiDAR, SRTM, Terrain 50, and unsmoothed LiDAR respectively.

In the early part of the track, the SRTM (red line) appears to be seeing the treetops or roofs of buildings either side of Chapel Hill, but levels out at a lower peak than the full resolution LiDAR (yellow line). It appears than the LiDAR is overestimating due to proximity of artificial structures, or possibly even vehicles in a traffic jam on the A390. The smoothed LiDAR follows the SRTM fairly closely.

Thursday 4 December 2014

Improved version of Cornwall maps in Cornish

As I said in my previous post, there were some areas such as river estuaries showing land where which is actually water. 

Using layers from www.mapcruzin.com (ultimately from OpenStreetMap) I add inland water, rivers, woodland and parks (semitransparent overplot). 

Using data dependent properties in QGIS, vary plotting of label text dependent on type (e.g. town, village) as specific in the placename layer.

edit: The Cornish placenames themselves are the list in the Standard Written Form produced by the MAGA Signage Panel.

Scale of 1:200000 for the below pages printed at A4.


Some manual editing was necessary to ensure the Cornwall/Devon border conforms to the treaty of 936 between kings Athelstan and Huwel.


 Maps for A3 paper


Wednesday 26 November 2014

A couple of extra links

A couple of extra links

A while ago I posted a links page. Here's a couple more that I saw recently.

The Geological Society has produced a 100-Great Geosites Interactive Map for UK and Ireland.

Also there is the Quaternary Research Society with their top 50 quaternary sites. 

Apparently the Giant's Rock in Porthleven floated there via an iceberg, possibly from Greenland.

Tuesday 18 November 2014

An unusual application of a MaxEnt habitat suitability model

The MaxEnt software is often used by ecologists, and others for species habitat modeling based on environmental layers.

So some data I used from the 2011 UK census (England, Wales and Cornwall) was 1. those with a skill in the Welsh language (the full question was only asked of census respondents living in Wales) and 2. those self-describing as Cornish for national identity.

The data is converted from census output polygons, to dots randomly placed within the part of the output polygon below 300m altitude.

Although there is quite a lot of land above 300m in Wales, there is actually only one or two census output area polygons that entirely disappear when terrain above 300m is cut out. So if you're in Blaenavon, apologies for deleting you.

Using the environmental layers of elevation, slope (from Shuttle Radar Topography Mission) and distance from the coast, this is the output:

Notice that the habitat suitability for Welsh speakers is actually higher in areas such as the North York Moors, and North Devon than Ynys Môn.


Habitat suitability drops off further than 60km from the coast

Altitudes of 200m-300m appear to be most suitable for Welsh speakers according to the observations of the census data.

The Welsh speakers are not suited to living on flat terrain.

A range of coastal areas are suitable for resettlement of the Cornish in the event of for example,  unexpected reactivation of the igneous activity of the Cornubian batholith.


Tuesday 28 October 2014

A map of Cornwall in Cornish

The Cornish Language Partnership has a list of placenames in Cornwall in the Cornish language.

I have downloaded a shapefile with locations of places from www.mapcruzin.com which ultimately derives from OpenStreetMap. To this I have added the Cornish placenames, and plotted on a map in QGIS.

I still need to add in other features like rivers etc., and find something to make sure that estuaries like the Fal are shown as water rather than appearing to be dry land.

The colour scheme might look familiar if you remember the old Bartholomews 1:100k maps.


An elevation aware cycling route planner?

For some time now, I've had an idea to produce an elevation aware cycling route planner. You see, Google Maps can give you a route, but it doesn't take account of hills when deciding it.

Basically the idea I have is based on attaching some kind of cost distance multiplier to segments of route.

One idea I have had is to use the RSGISLib tools to segment a layerstacked digital elevation model, consisting on the elevation, slope, aspect (degrees from N) and then intersect this with a map of the road network (it is possible to download versions of this derived ultimately from OpenStreetMap and the OS OpenData has data available as well) to make road segments that have a consistent slope.

Then the average slope in the direction of the road could be calculated, and from this a cost-distance multiplier.

This is a segmented DEM in mid-Cornwall from the SRTM and with a pixel size of 73m, with a minimum object size of 9 pixels.


I haven't yet worked out how to complete this, one important thing is that the relevant slope is that in the direction of the road rather than the absolute value, and of course it is different if traversed in the reverse direction. So perhaps it would be necessary to convert every road into two one-way roads, so that the cost-distance could be calculated separately for each direction

Wednesday 1 October 2014

The disappearence of Cantre'r Gwaelod

Again based on Shennan & Horton 2002:


Now just a little bit beyond the present coastline in certain places, such as near Borth where the preserved forest can be seen when the sea strips back the sand (often low tides after storms are a good time to see it).

Tuesday 30 September 2014

The lost land of Lyonesse

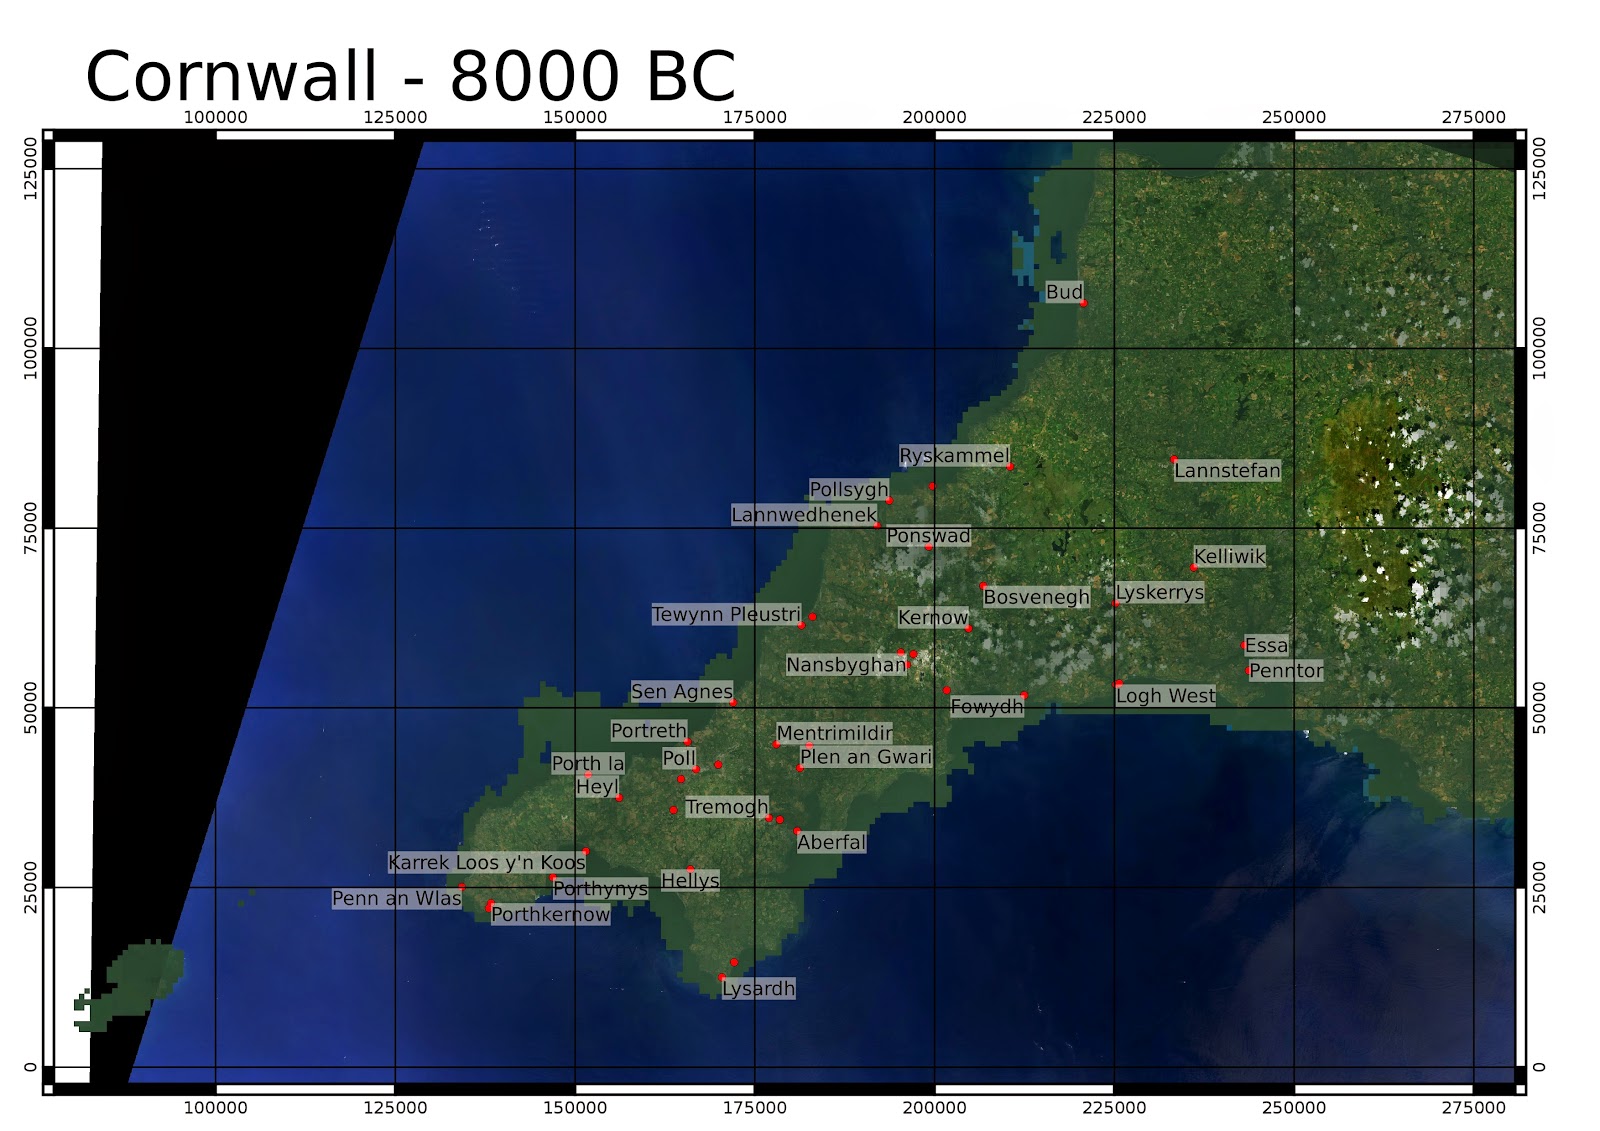
Here are some visualisations of Cornwall 12,000 to 5,000 years ago:

Sea level is based on Shennan and Horton 2002, with a triangular interpolation. Background is Landsat 8 from 25th July 2014. OSGB numerical coordinates.

The bathymetry is from GEBCO which has a 30 arcsecond resolution (about 600m at 50 degrees latitude). Higher resolution bathymetry is now available from the INSPIRE portal. I am planning to make some more detailed maps with this.

I've not removed man made structures including reservoirs and china clay pits. I have added a little semi-transparent dark green colour in the lower elevations to simulate dense forest in the valleys which is thought to have been the case in the Neolithic.

The Cornish name for St. Michael's Mount, is "Karrek Loos y'n Koos" - "The Grey Rock in the Wood".


Around the time period of the Younger Dryas stadial, estimated as 10,800 to 9500 BC. At the end of this stadial, the climate warmed rapidly to approximately present levels (Holocene temperature variations - Wikimedia commons).


See NOAA Paleoclimateology program for details on the 8.2ka event (6200BC), where the glacial Lake Agassiz drained in the Hudson Bay region. Legend has it that the land of Lyonesse was drowned in a single great storm.


The coastline 5000 years ago is broadly similar to today, though there are some areas such as the area near St. Michael's Mount (Karrek Loos y'n Koos) where land existed which is now submerged. In a future post I  will produce a better map from higher resolution bathymetry which is now available from the INSPIRE portal.

Dissertation done, and the likelihood of Martian glaciers in Cornwall, Wales and south-west England

So, the dissertation is done now, you can get a copy here, or a special tablet-optimised version here. The latter is using the US Supreme Court's paper size and Century Schoolbook font, as was advised to me by http://en.wikibooks.org/wiki/LaTeX/Page_Layout.

In the dissertation itself, I explain that the Martian terrain is segmented using RSGISLib and a classifier function assigned to the segments using the Souness et al. 2012 glacier-like forms as a guide.

So what if we apply it to a terrain that is not on Mars? The Shuttle Radar Topographic Mission data is available at a similar resolution to that from HRSC for Mars.

I have done the segmentation for areas of Wales, Cornwall and the southwest of England using topography only rather than integrating the red image field, since it wouldn't really be comparable with all the vegetation etc. on the Earth.

The same procedure of highlighting segments with log(K) > 12, 13, 14, 15 with a semi-transparent overlay is used. The background images are from Landsat 8 using bands 6, 5, 2 for RGB. All images from 25th July 2014.

Ordnance Survey GB numerical coordinates are used.

Not much in West Cornwall, except on the north-facing slopes west of St. Ives. There are a few more segments on the North Cornwall coast and in some areas of southeast Cornwall.
The north coast of West Penwith has a high likelihood of Martian glaciers, see also the map in the following post which shows a relatively shallow area of sea that would have been dry land in the Early Holocene, perhaps sediment deposited by the Martian glaciers at some point.

Some martian glaciers expected on the northern fringe of Dartmoor near Okehampton, but perhaps surprisingly also in south Devon.

Exmoor seems a favoured location for martian glaciers.

The Welsh valleys and the Brecon Beacons are also highlighted for a high likelihood of martian glaciers.


Since Wales generally has a higher likelihood of martian glaciers, I have used a slightly different scaling with only starting to highlight at log(K) > 13:
A close up of the Valleys and Brecon Beacons:


Mid-Wales:
North Wales:

Snowdonia:

Aberystwyth area:

The southern part of Cwm Rheidol appears particularly favoured for martian glaciers.