Showing posts with label meriga project. Show all posts

Saturday, 23 July 2016

Retrotopia draft map

The author John Michael Greer has been publishing a speculative fiction series currently on his blog, The Archdruid Report called 'Retrotopia'. It is set in around 2065, in a North America that has undergone some changes after the breakup of the USA.


Here is a draft map, based on his descriptions in the comments to a recent post, showing the approximate borders of the successor states to the USA and Canada. I have yet to deal with states that are split between more that one nation in 2065.

The nations of the Retrotopia stories, not including at this time states that are split between more than one Retrotopia nation. No account of sea level rise is made, which is assumed to be 6 feet above present day levels.
I used a map of US counties from here, and US state, and Canadian province shapefiles from here. Update - I switched to using this map of Canadian provinces which includes Nunavut.

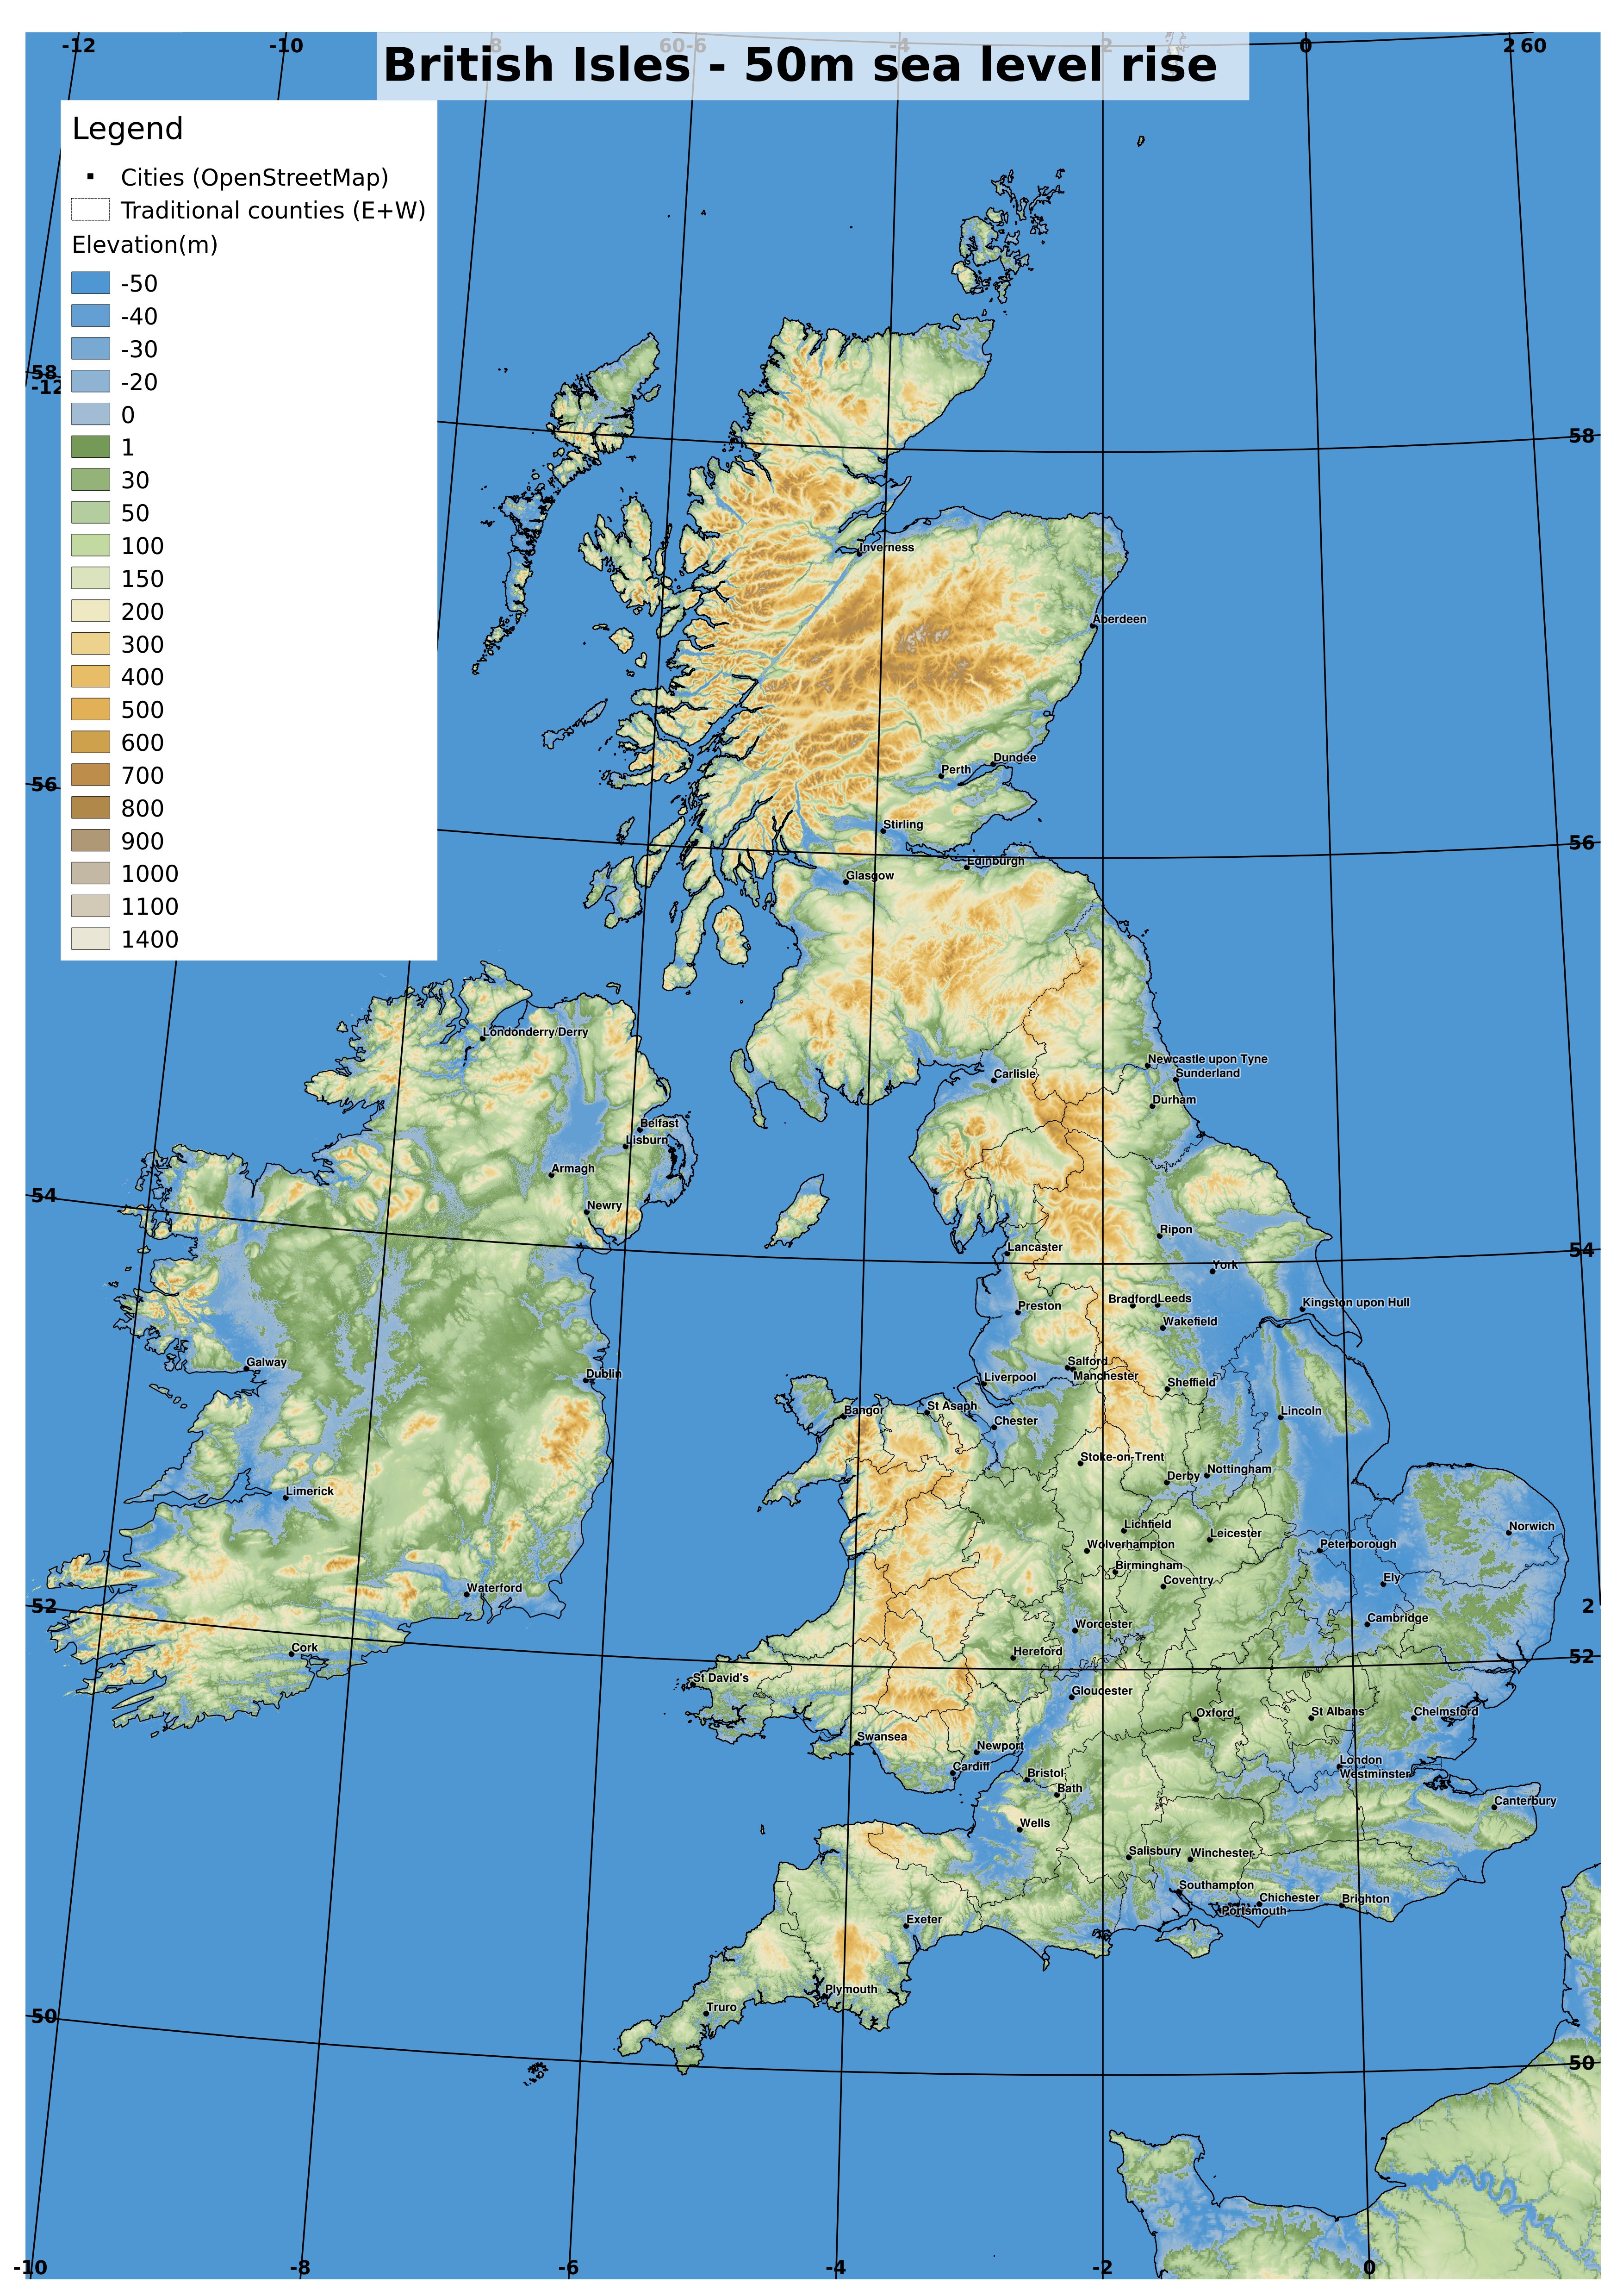
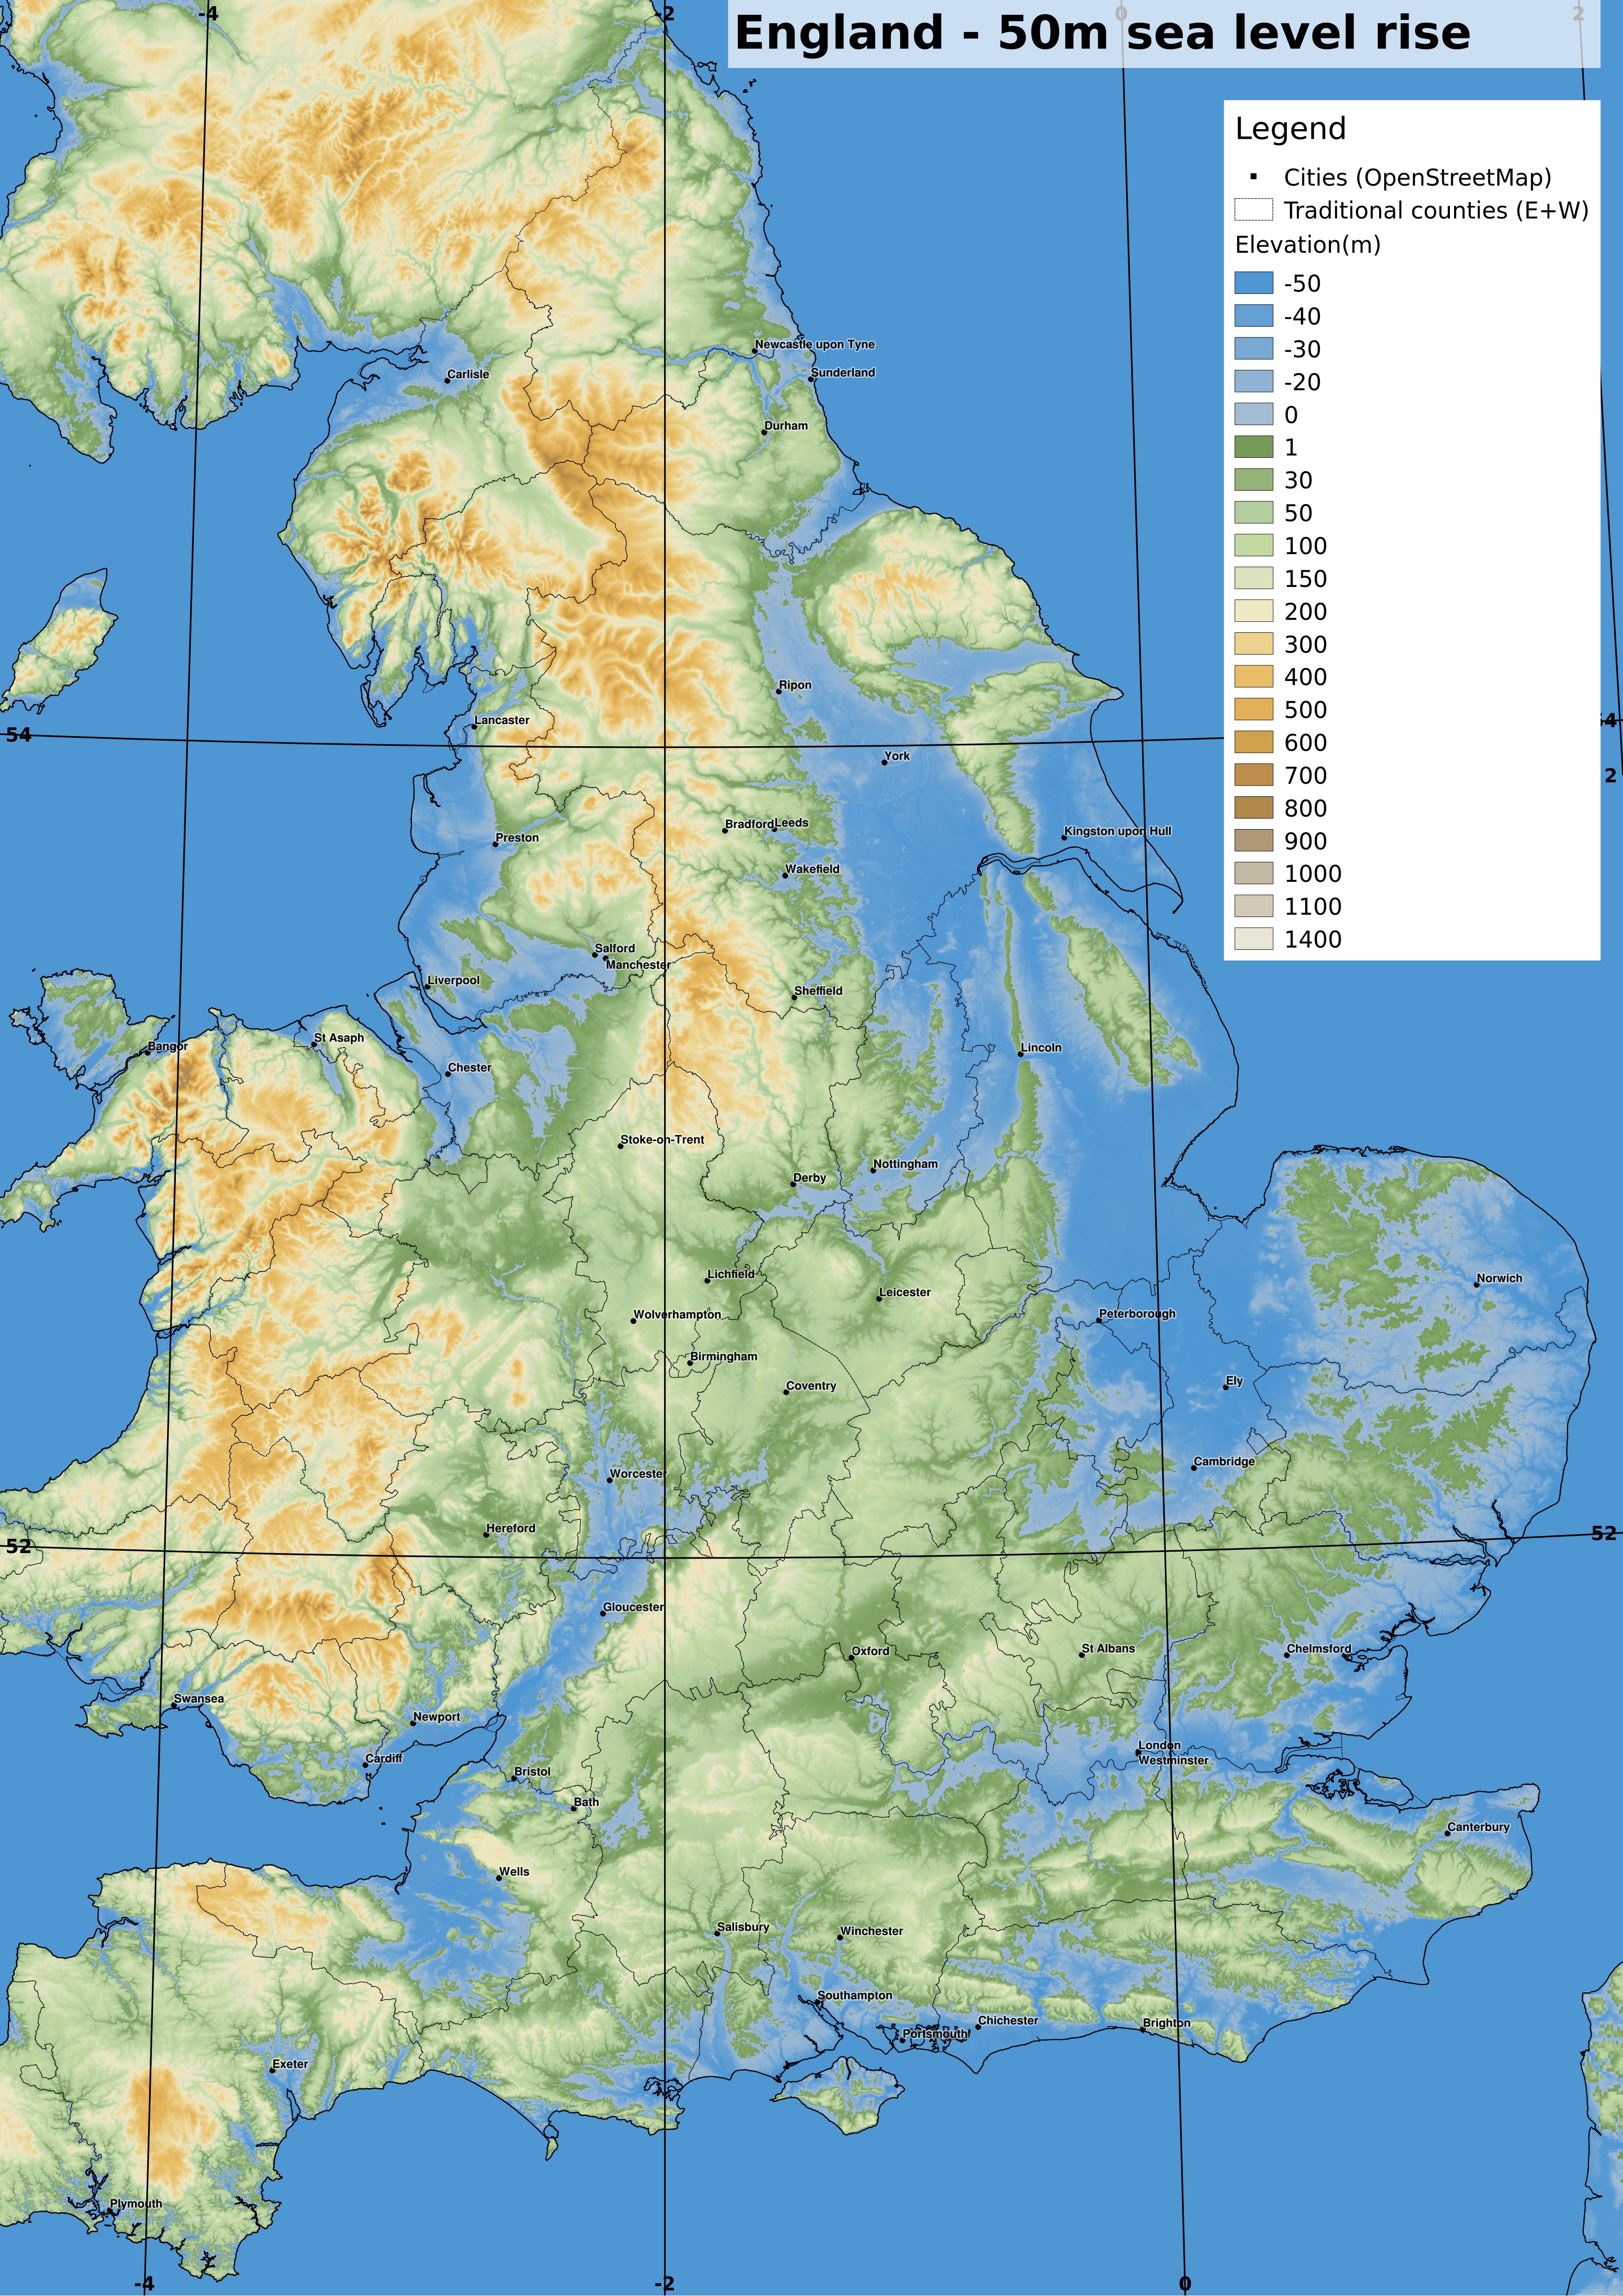
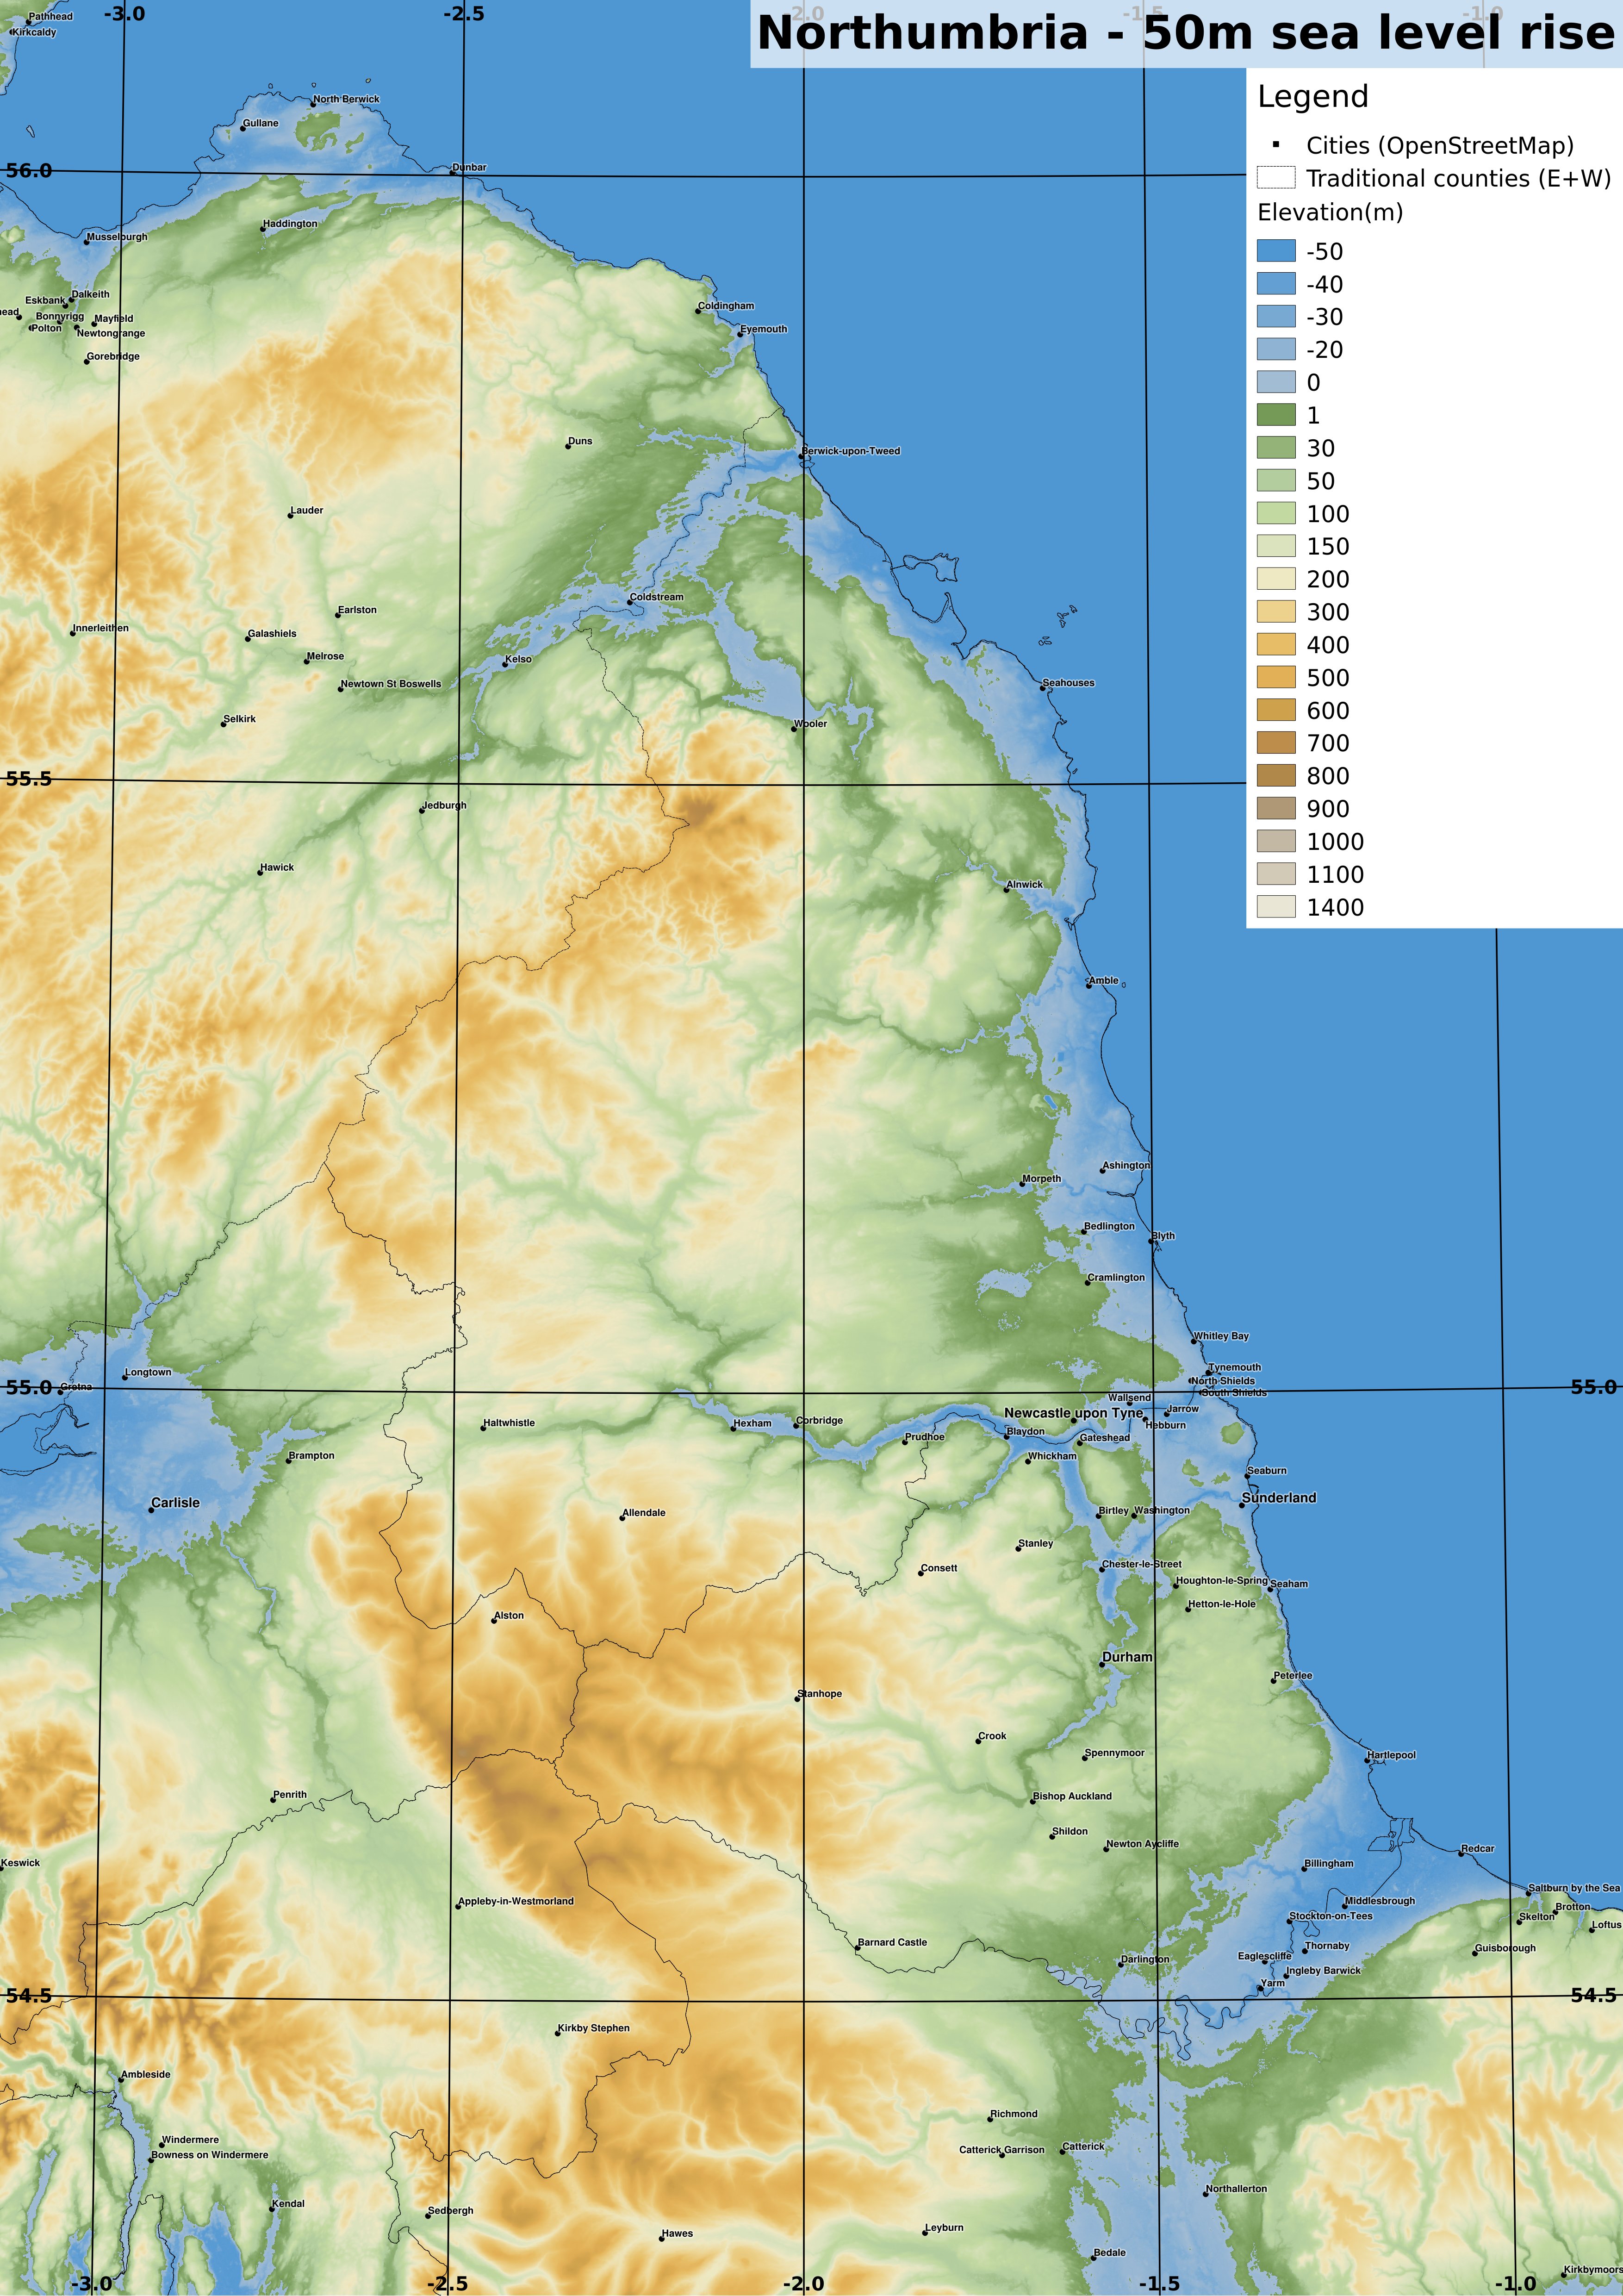
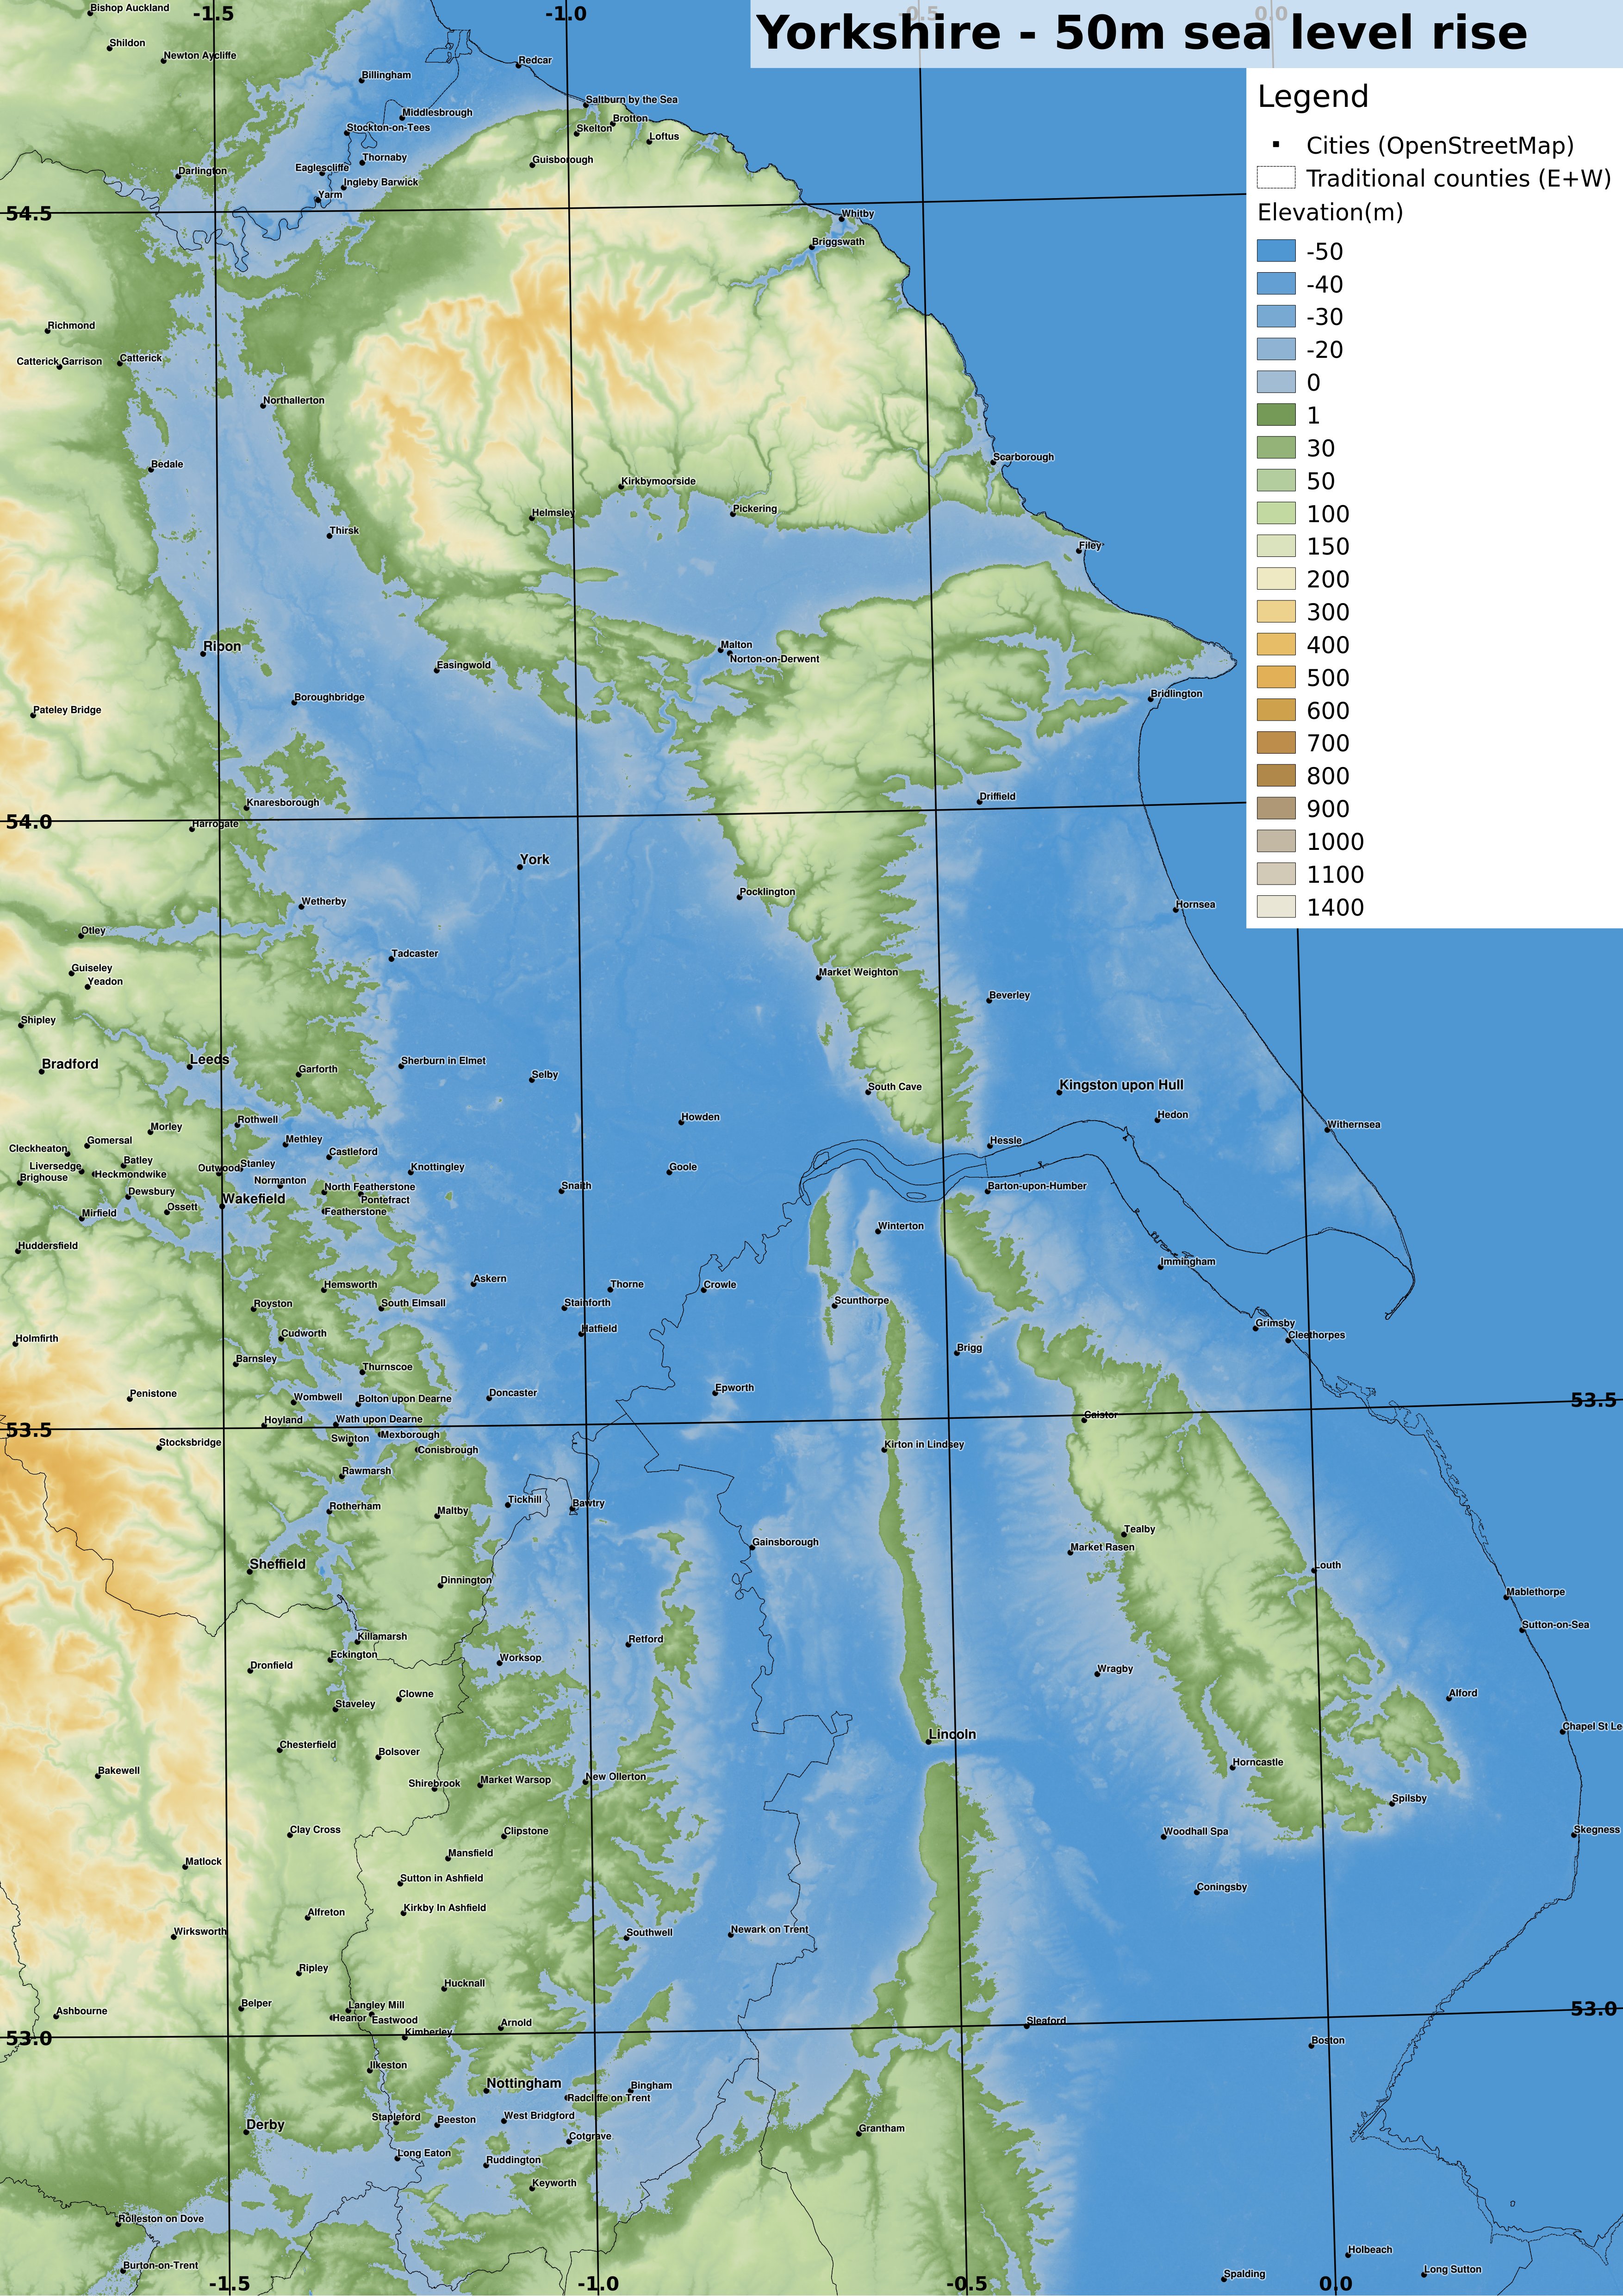
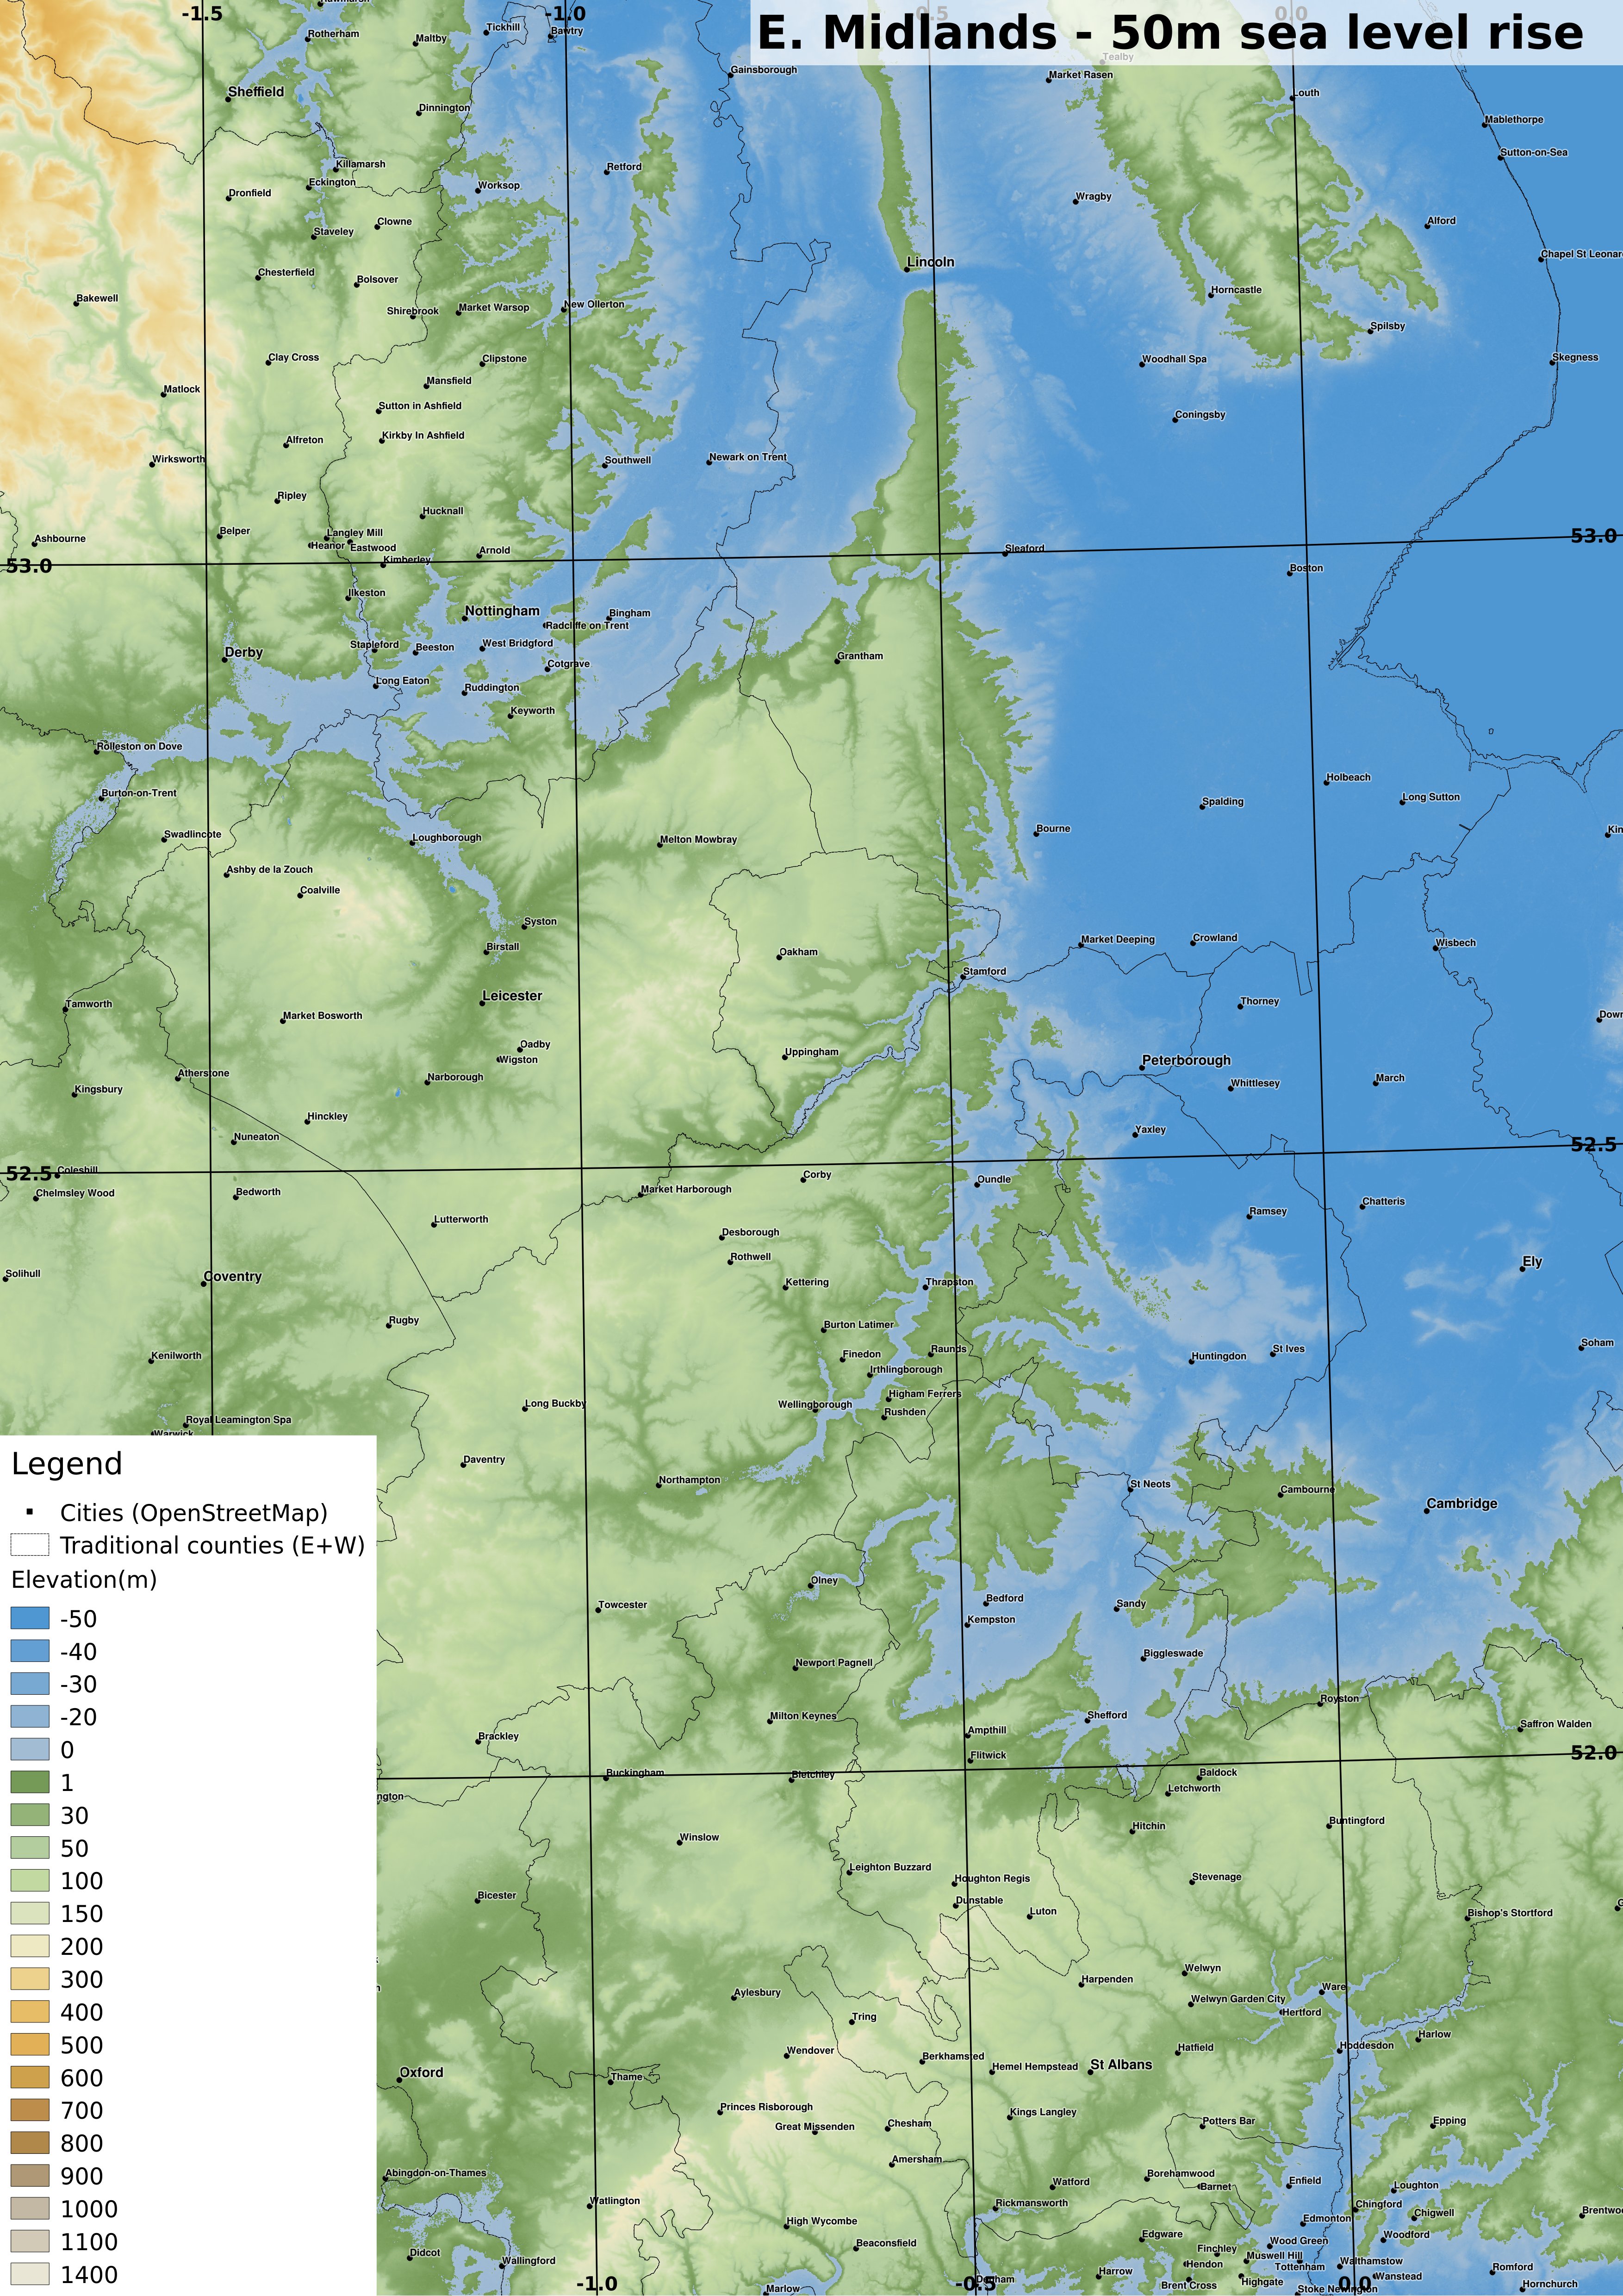
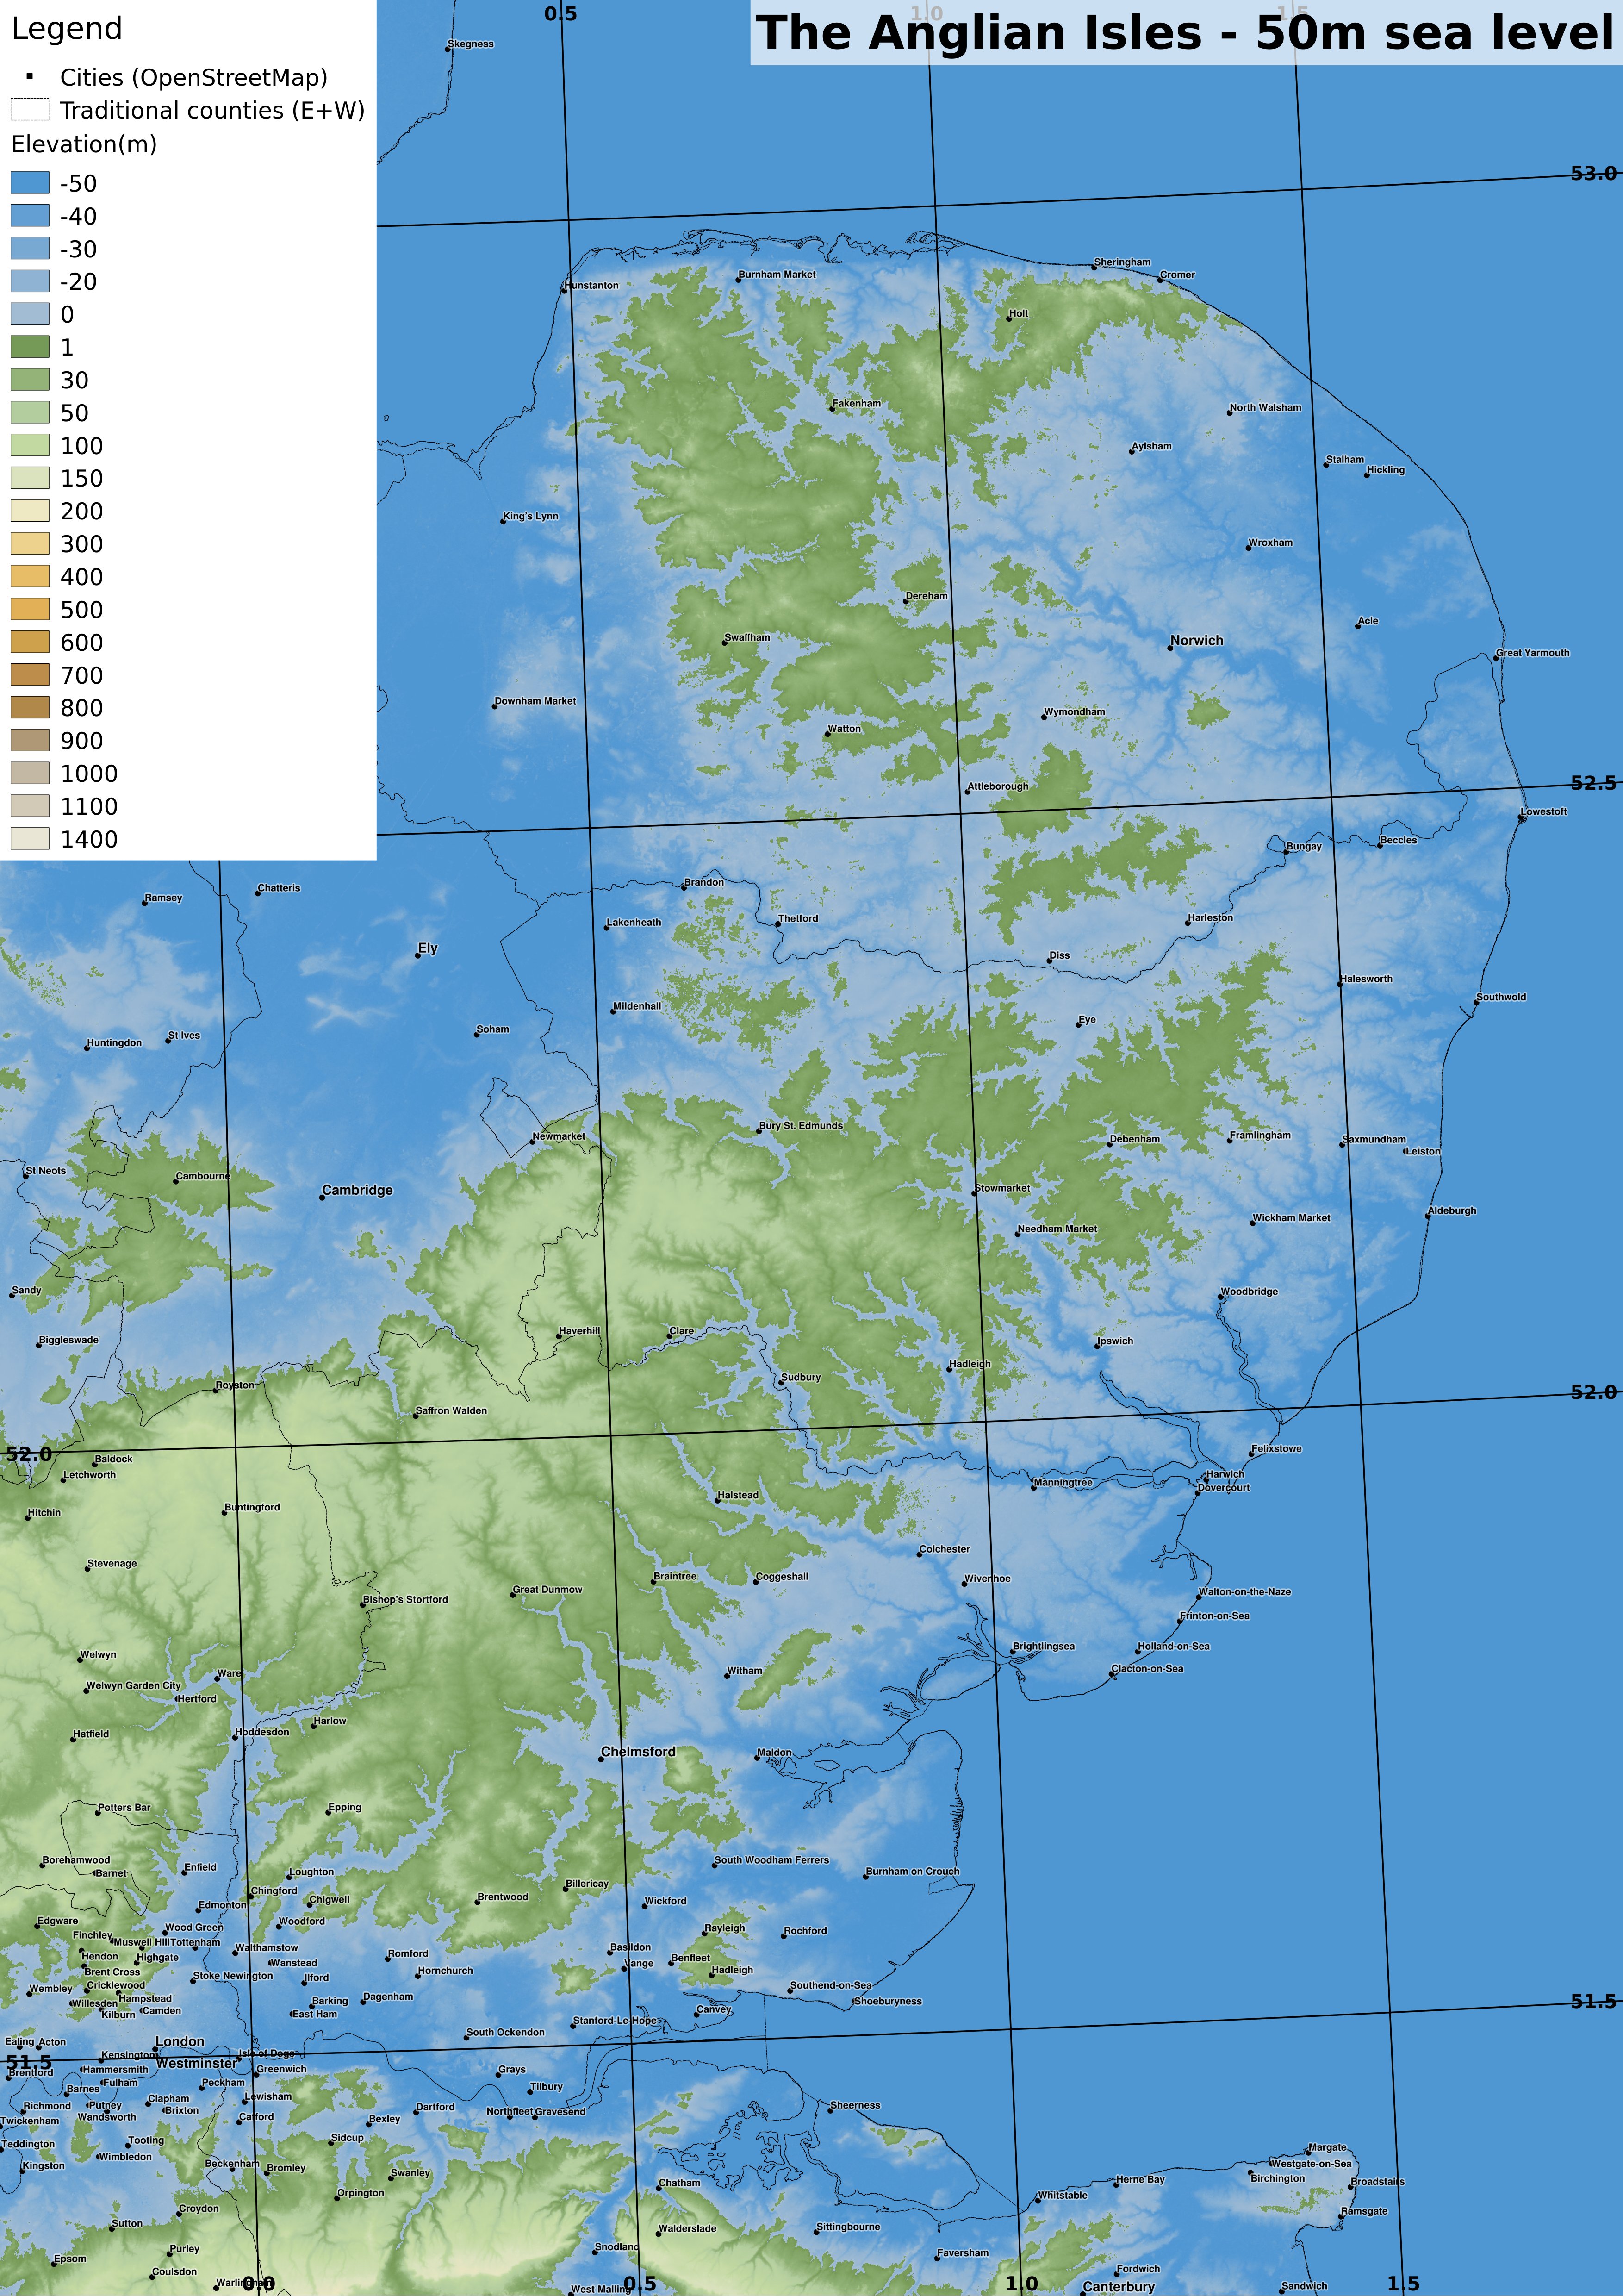
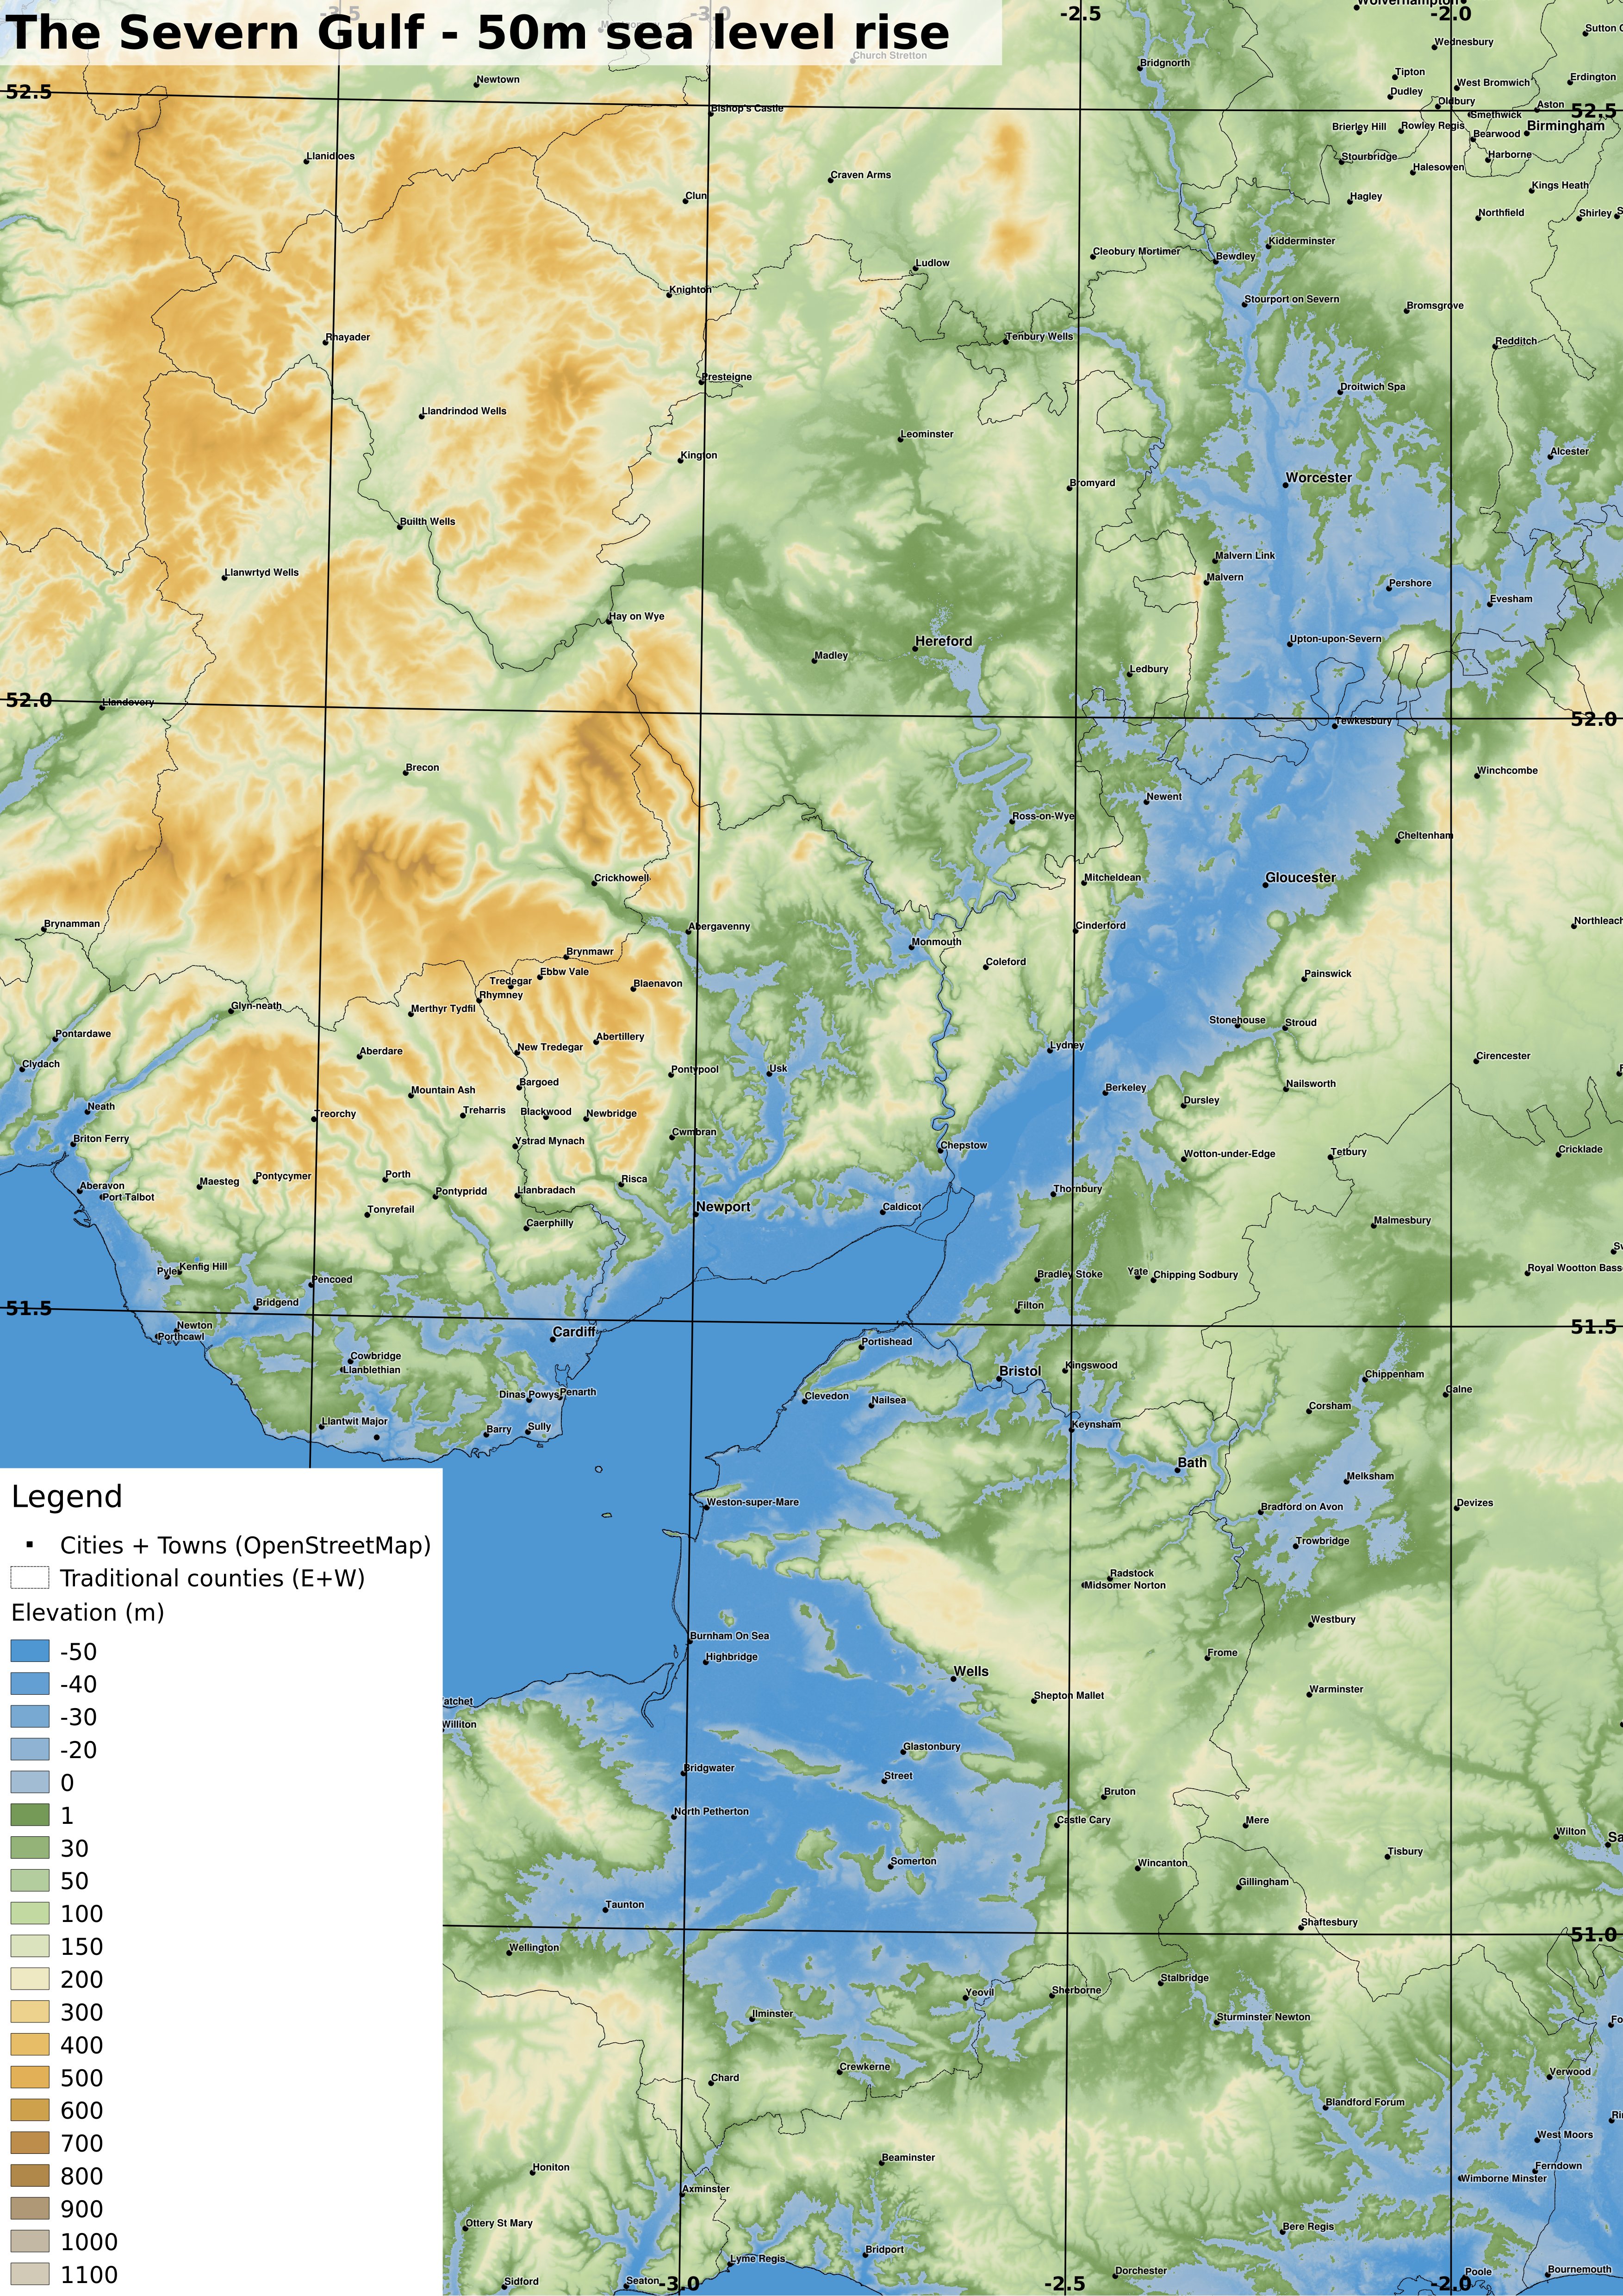
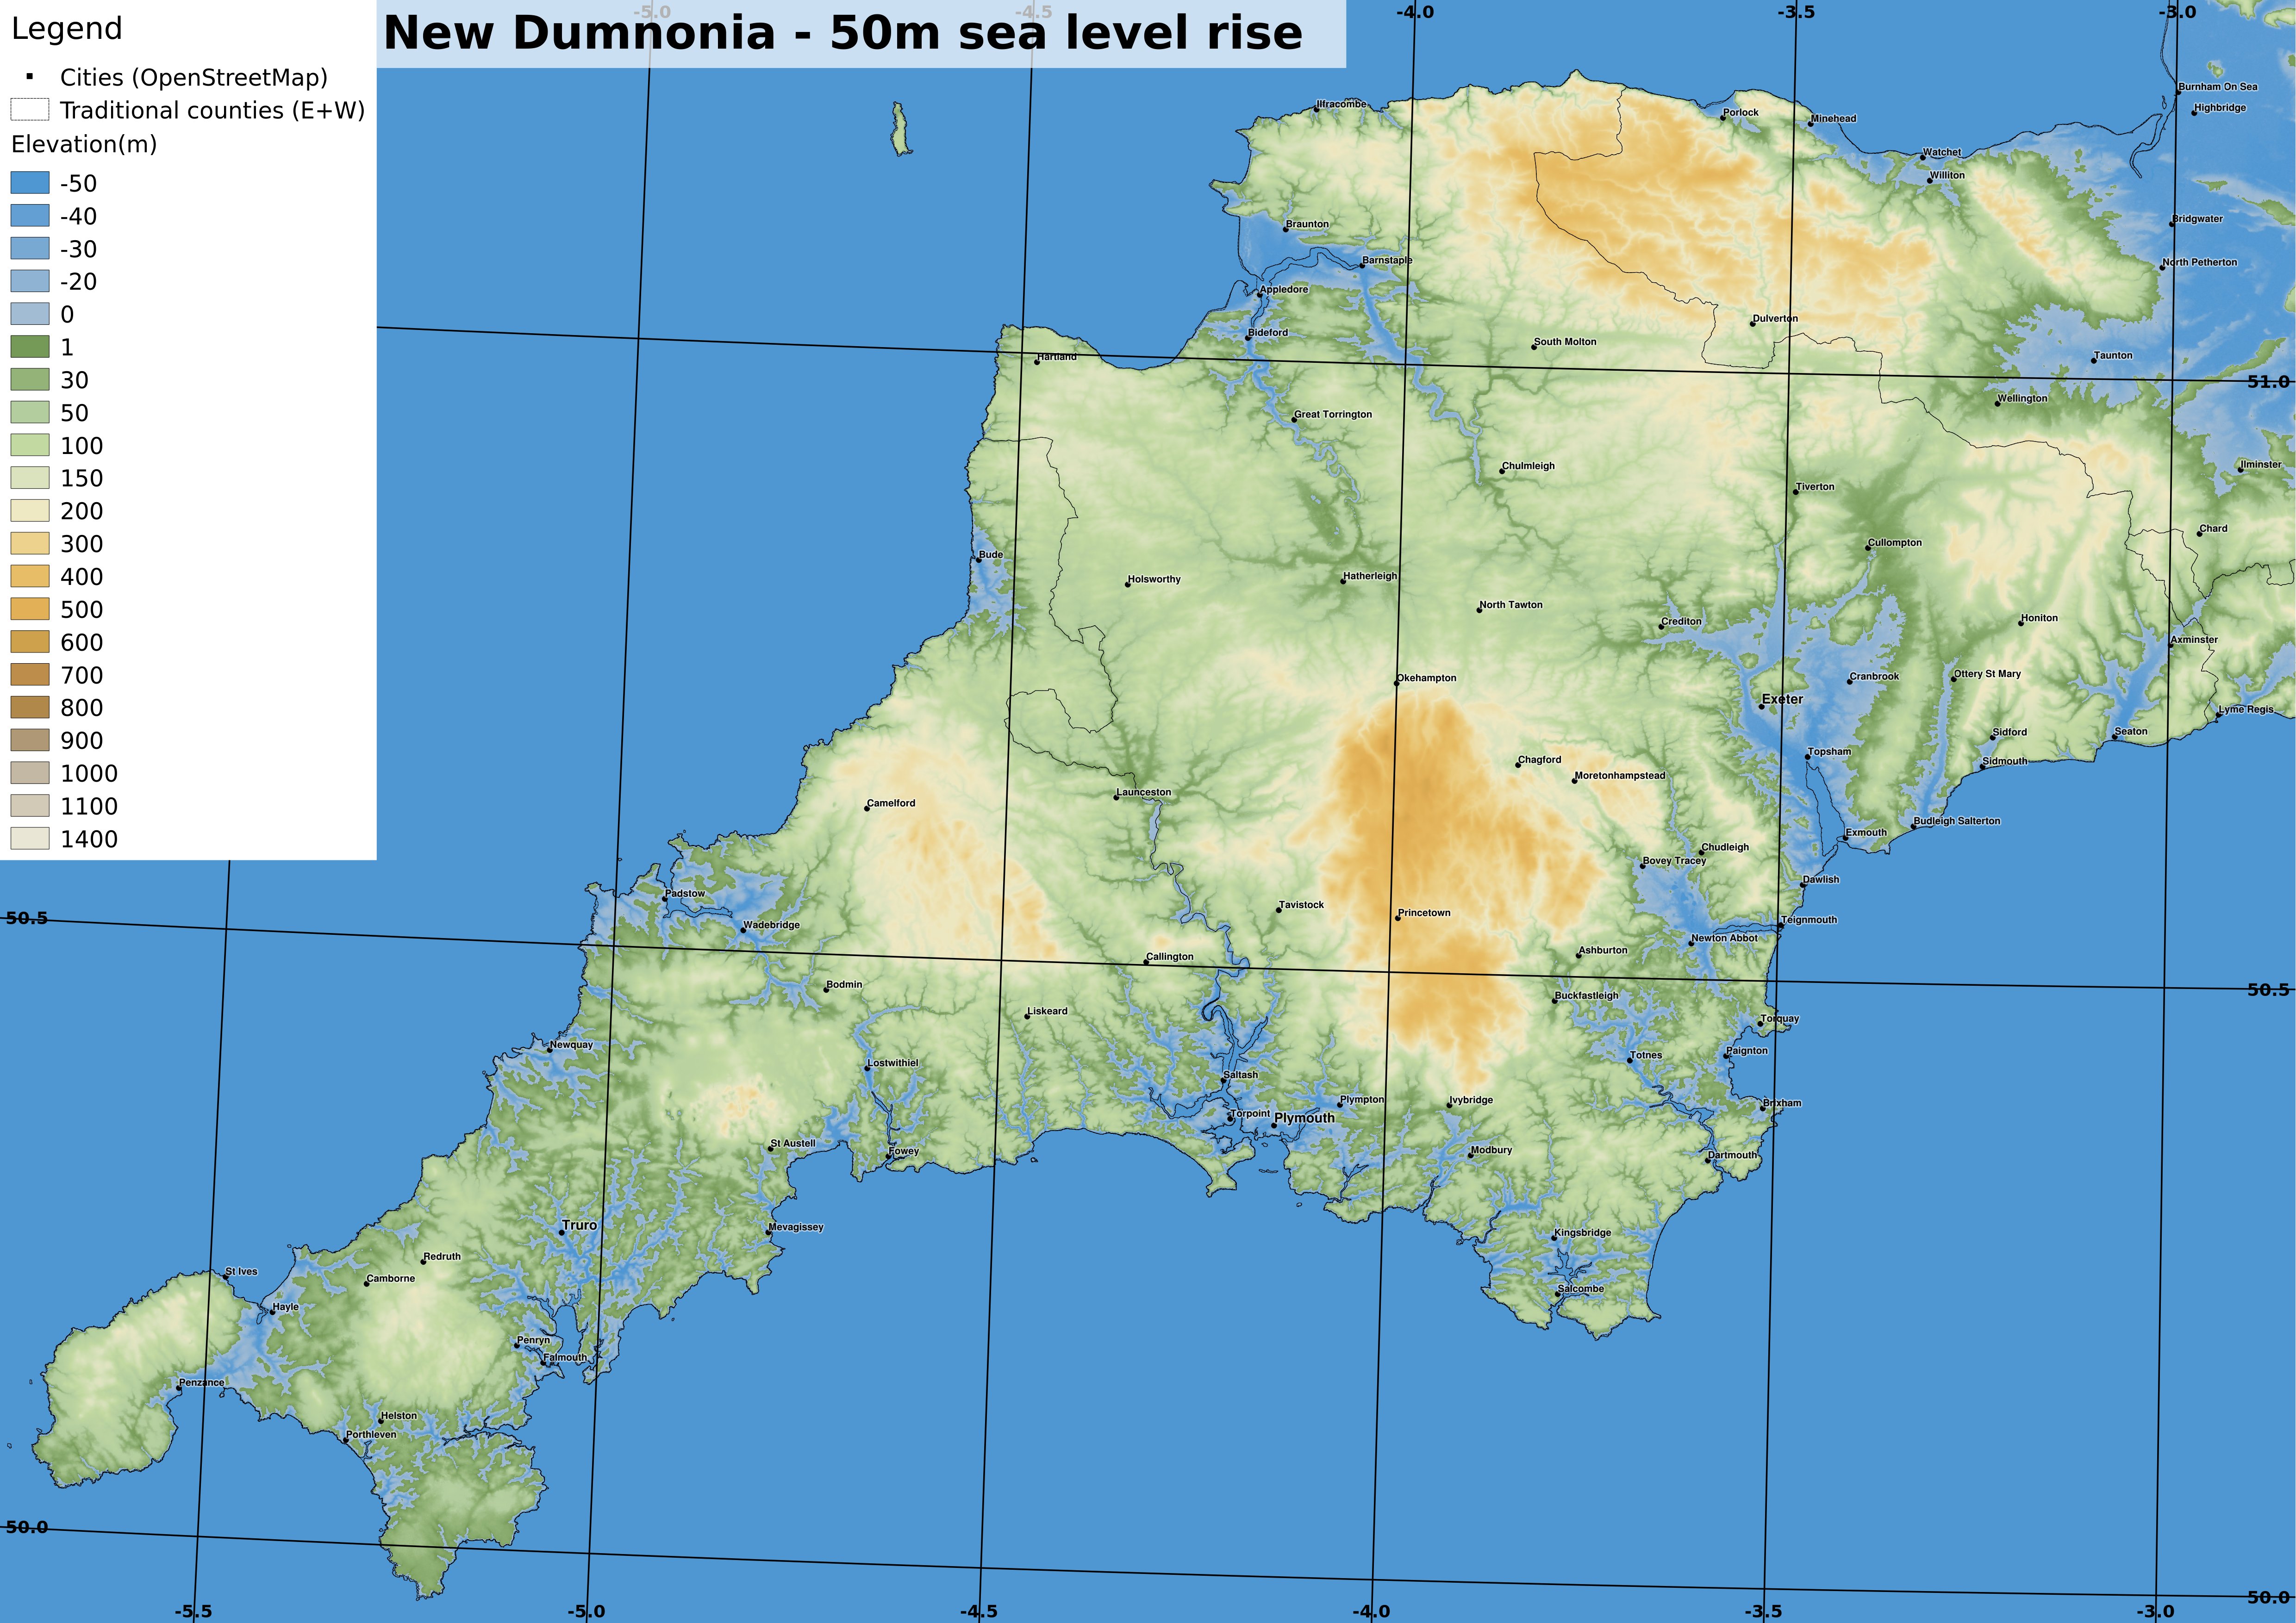
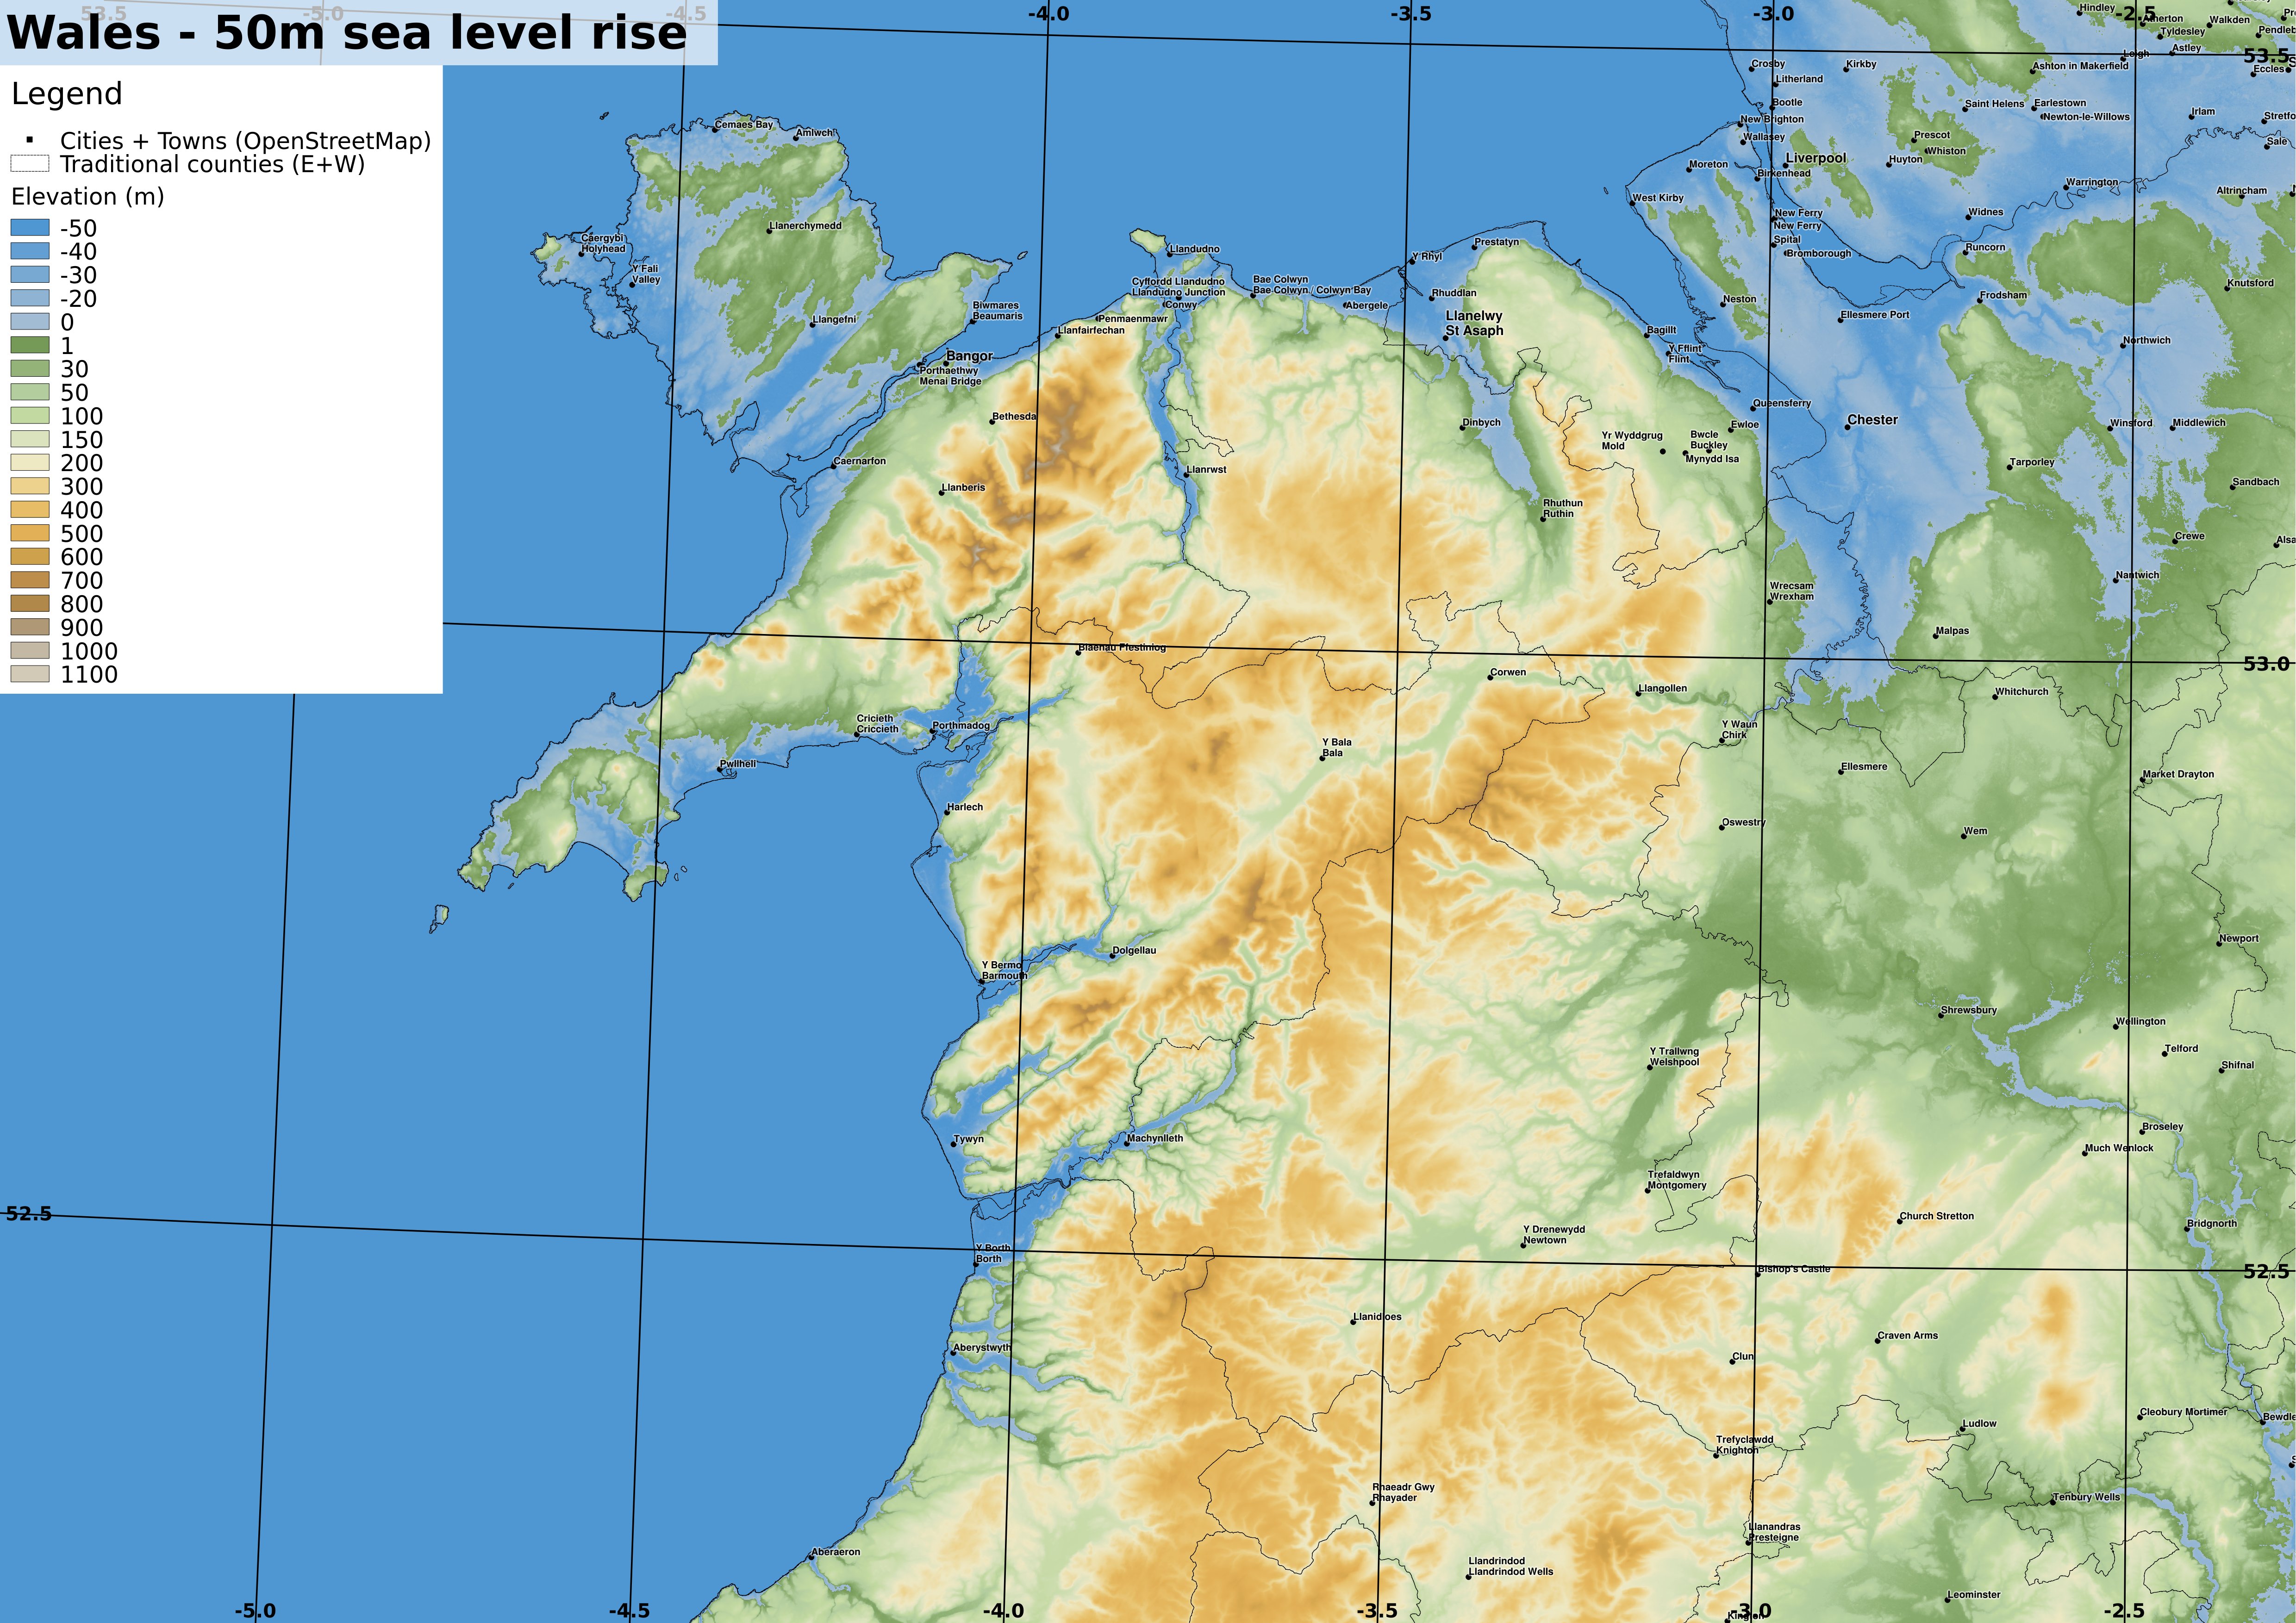
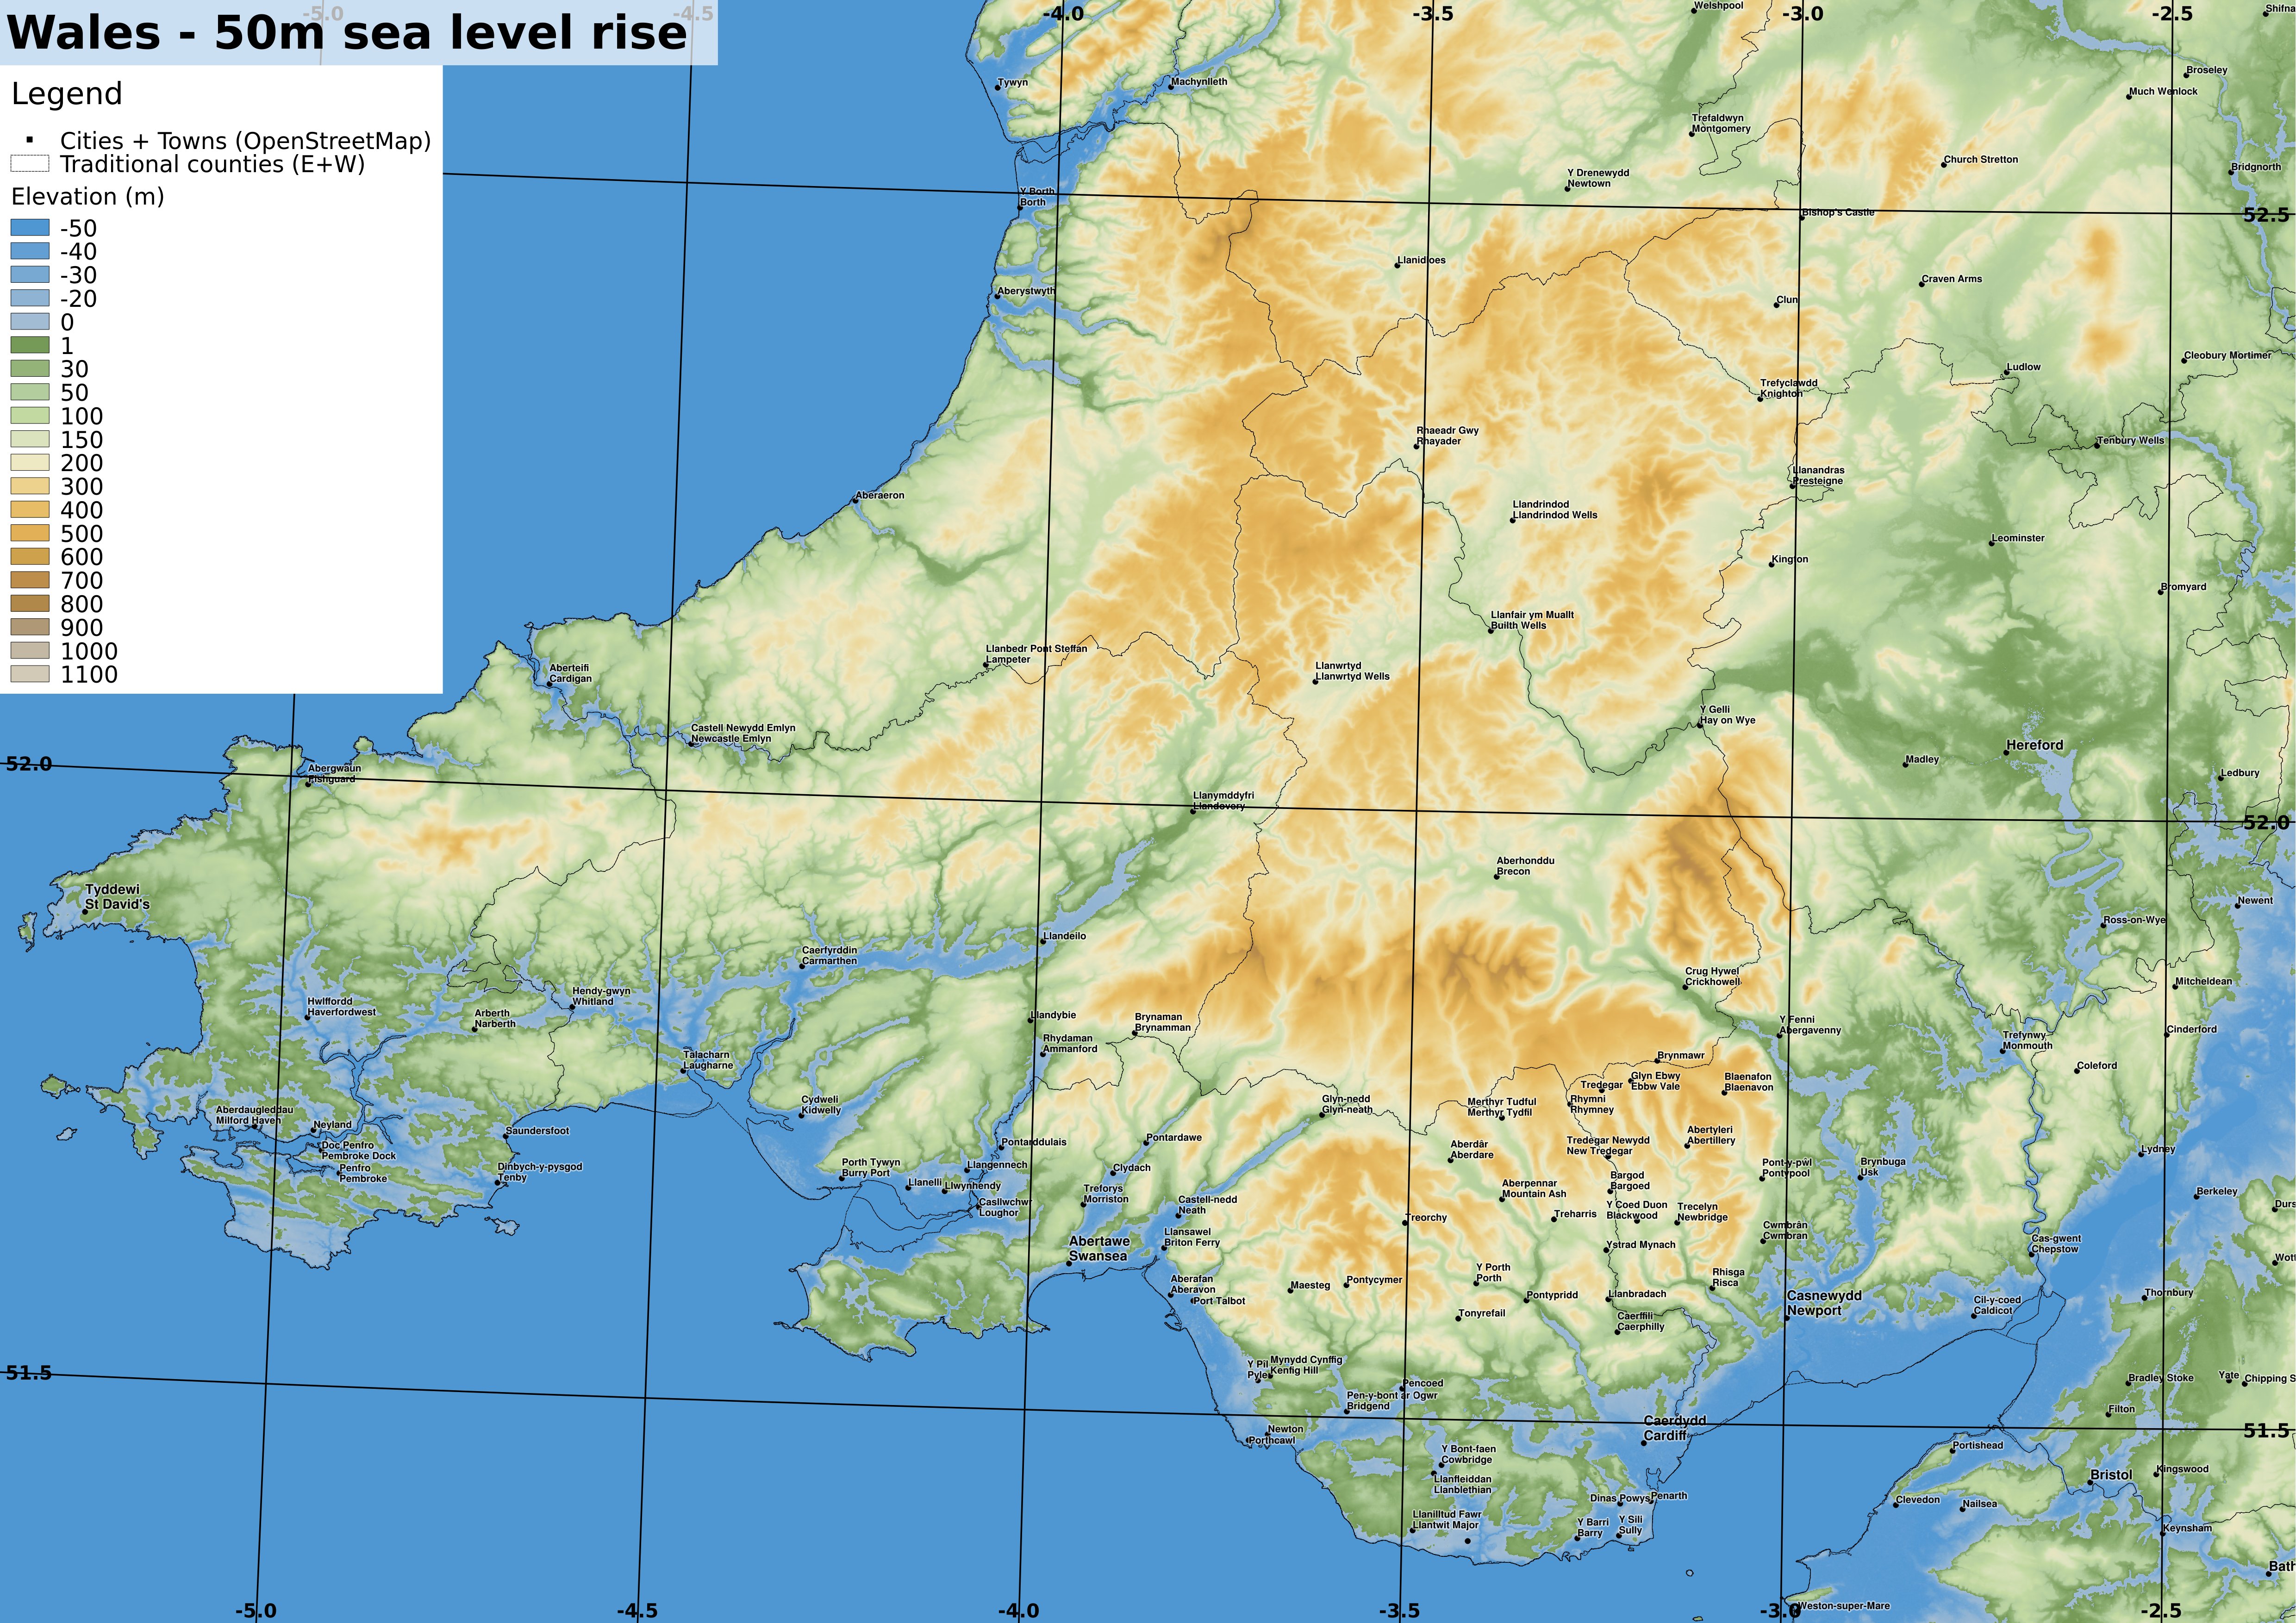
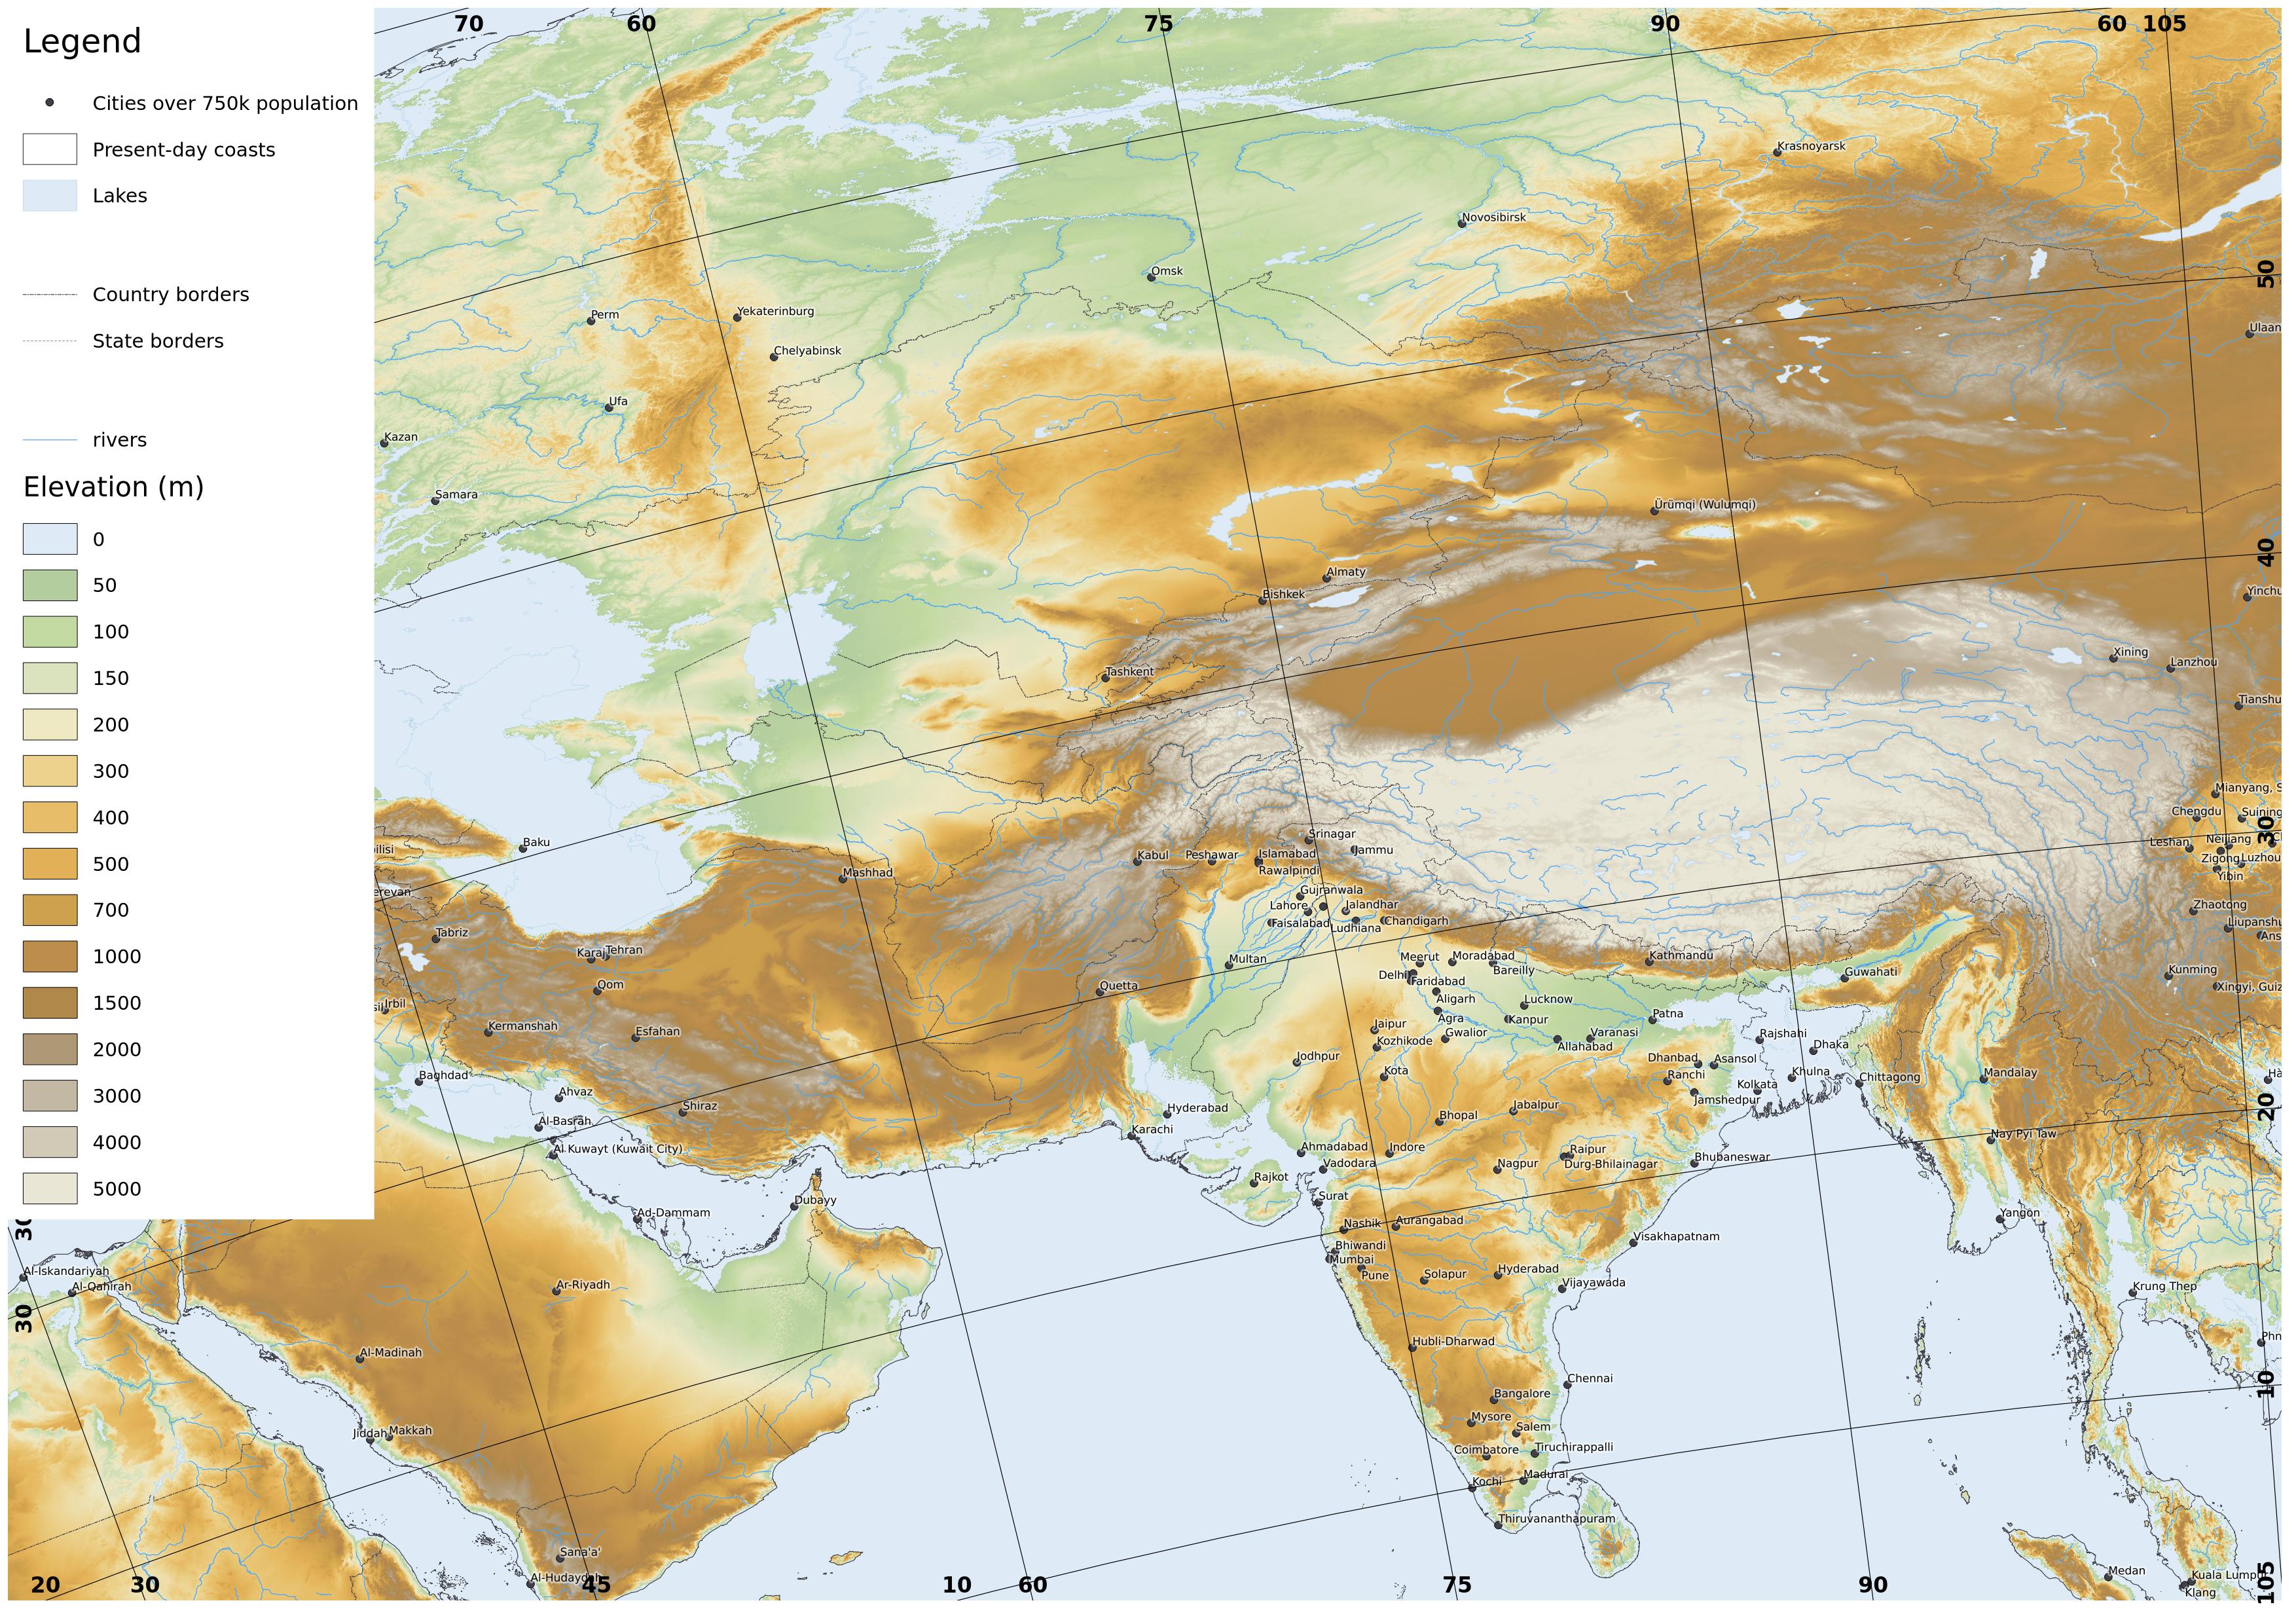
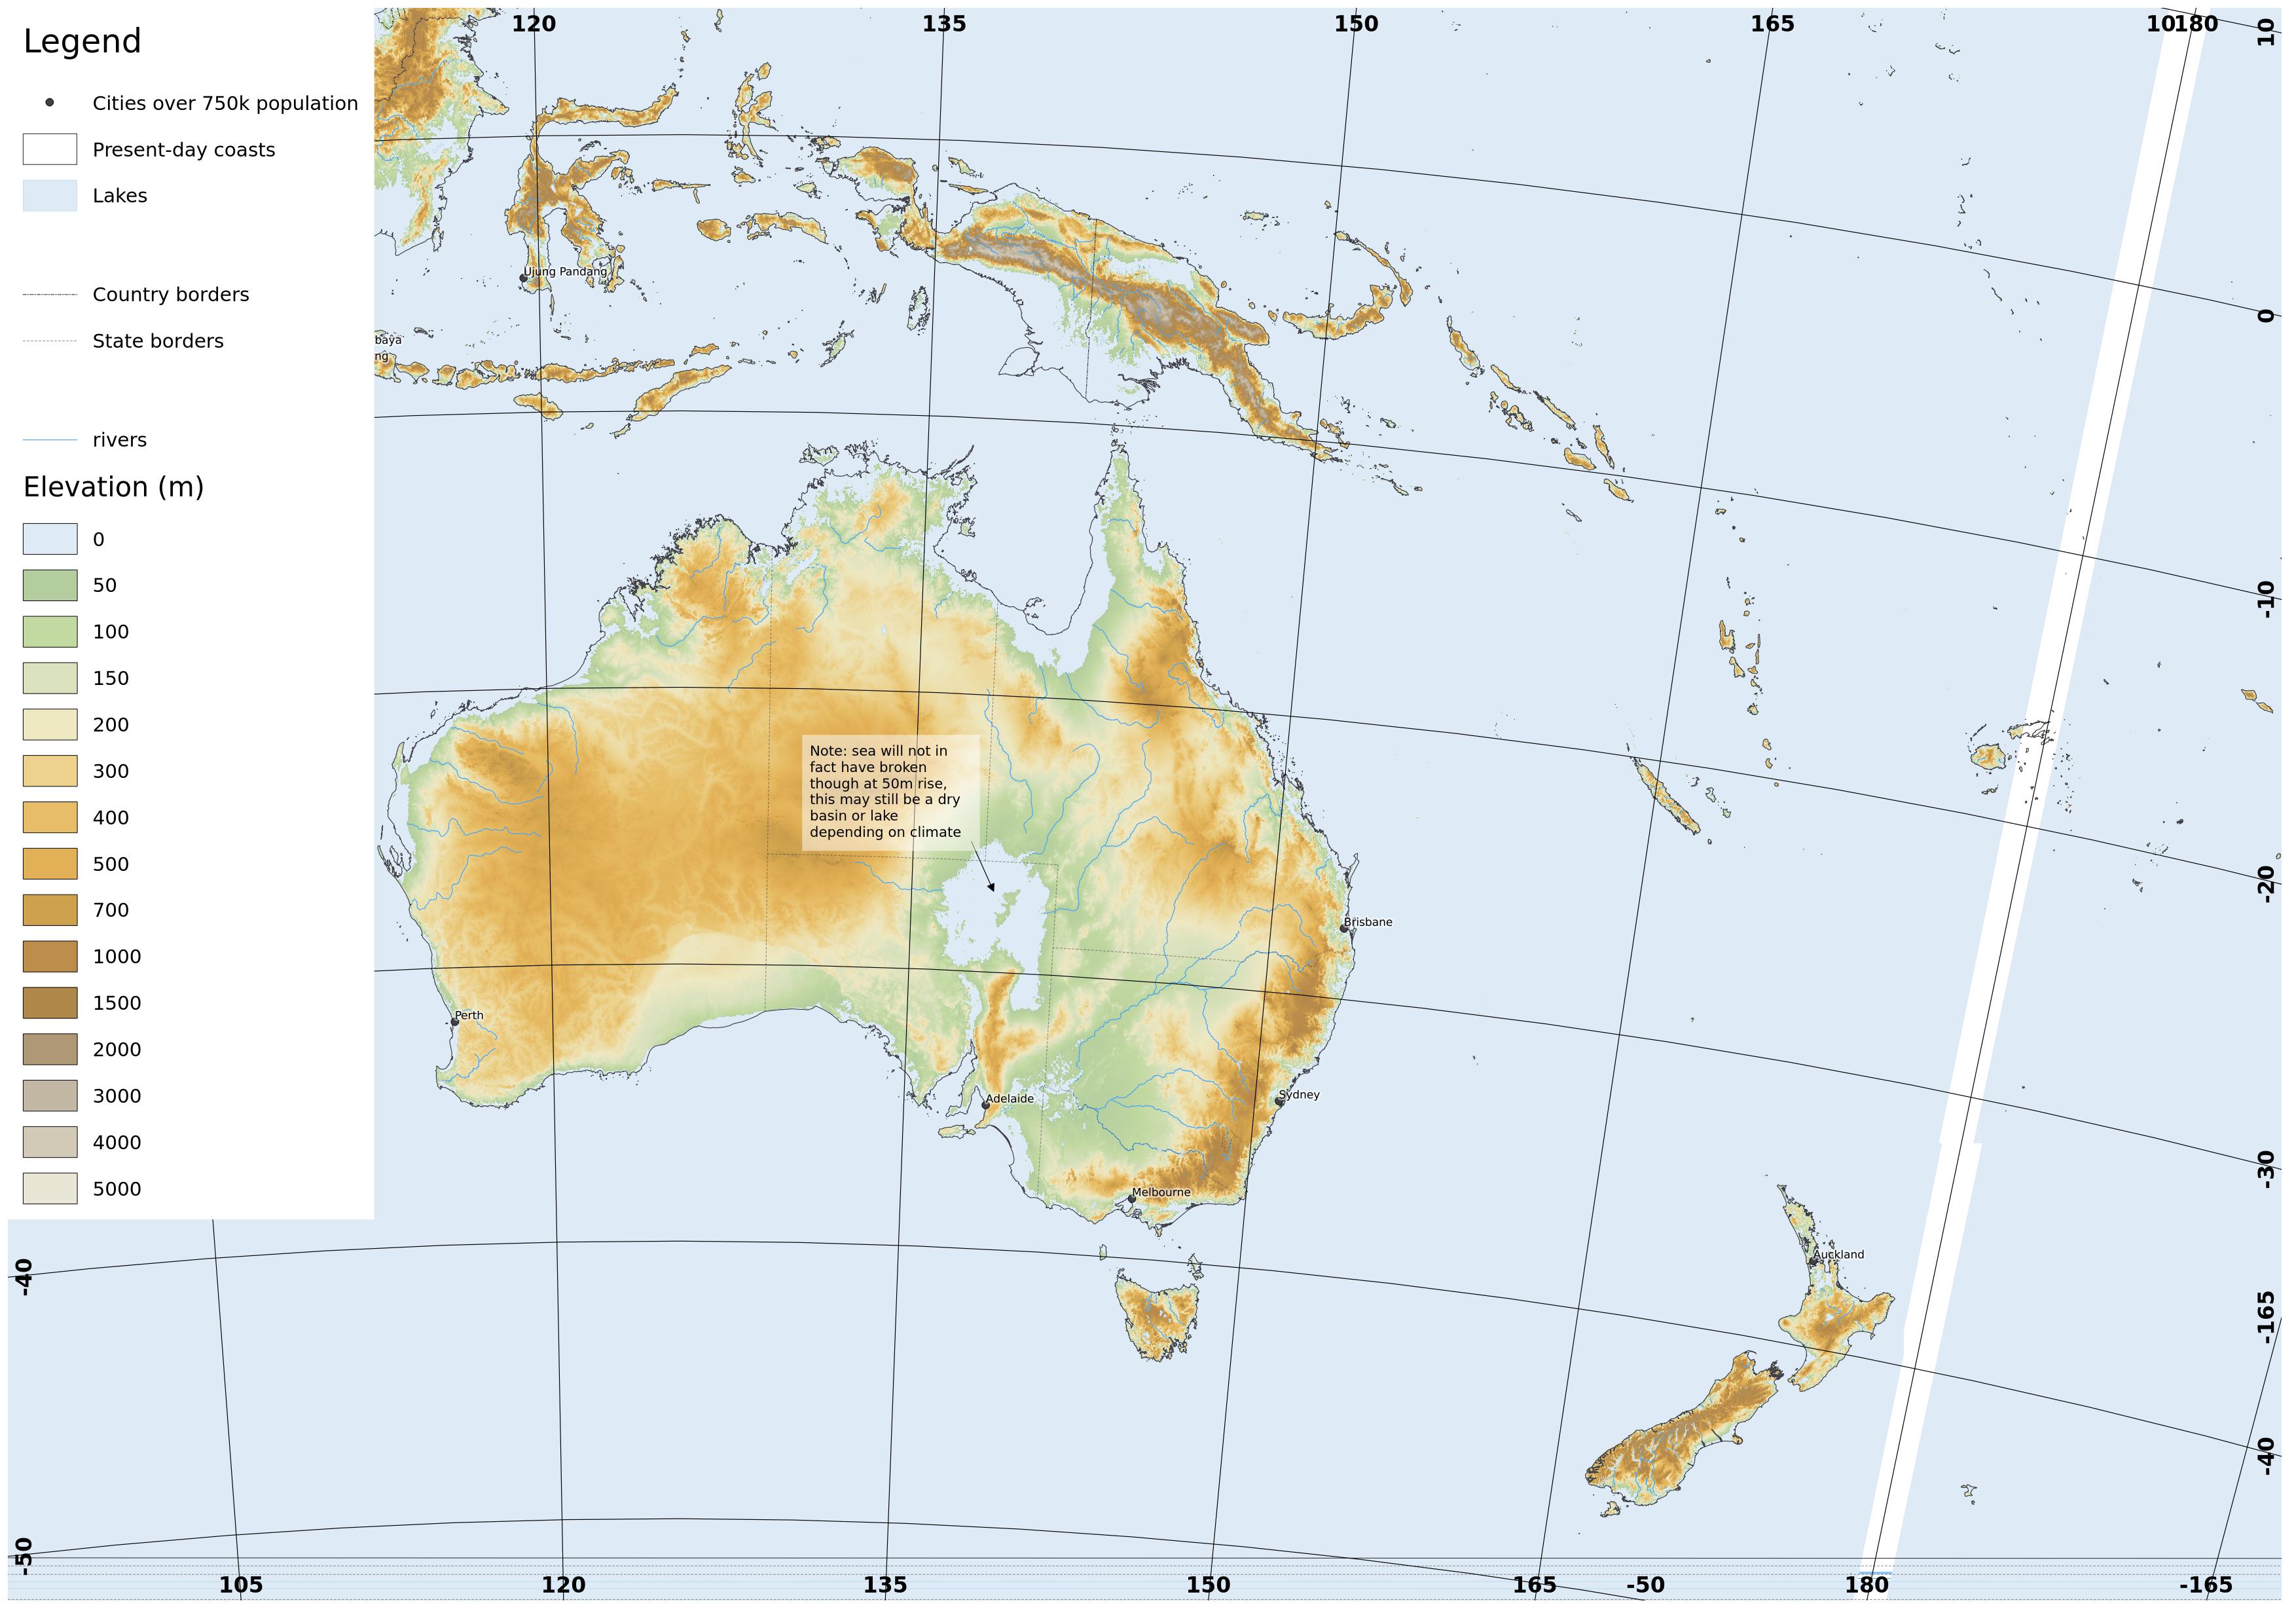
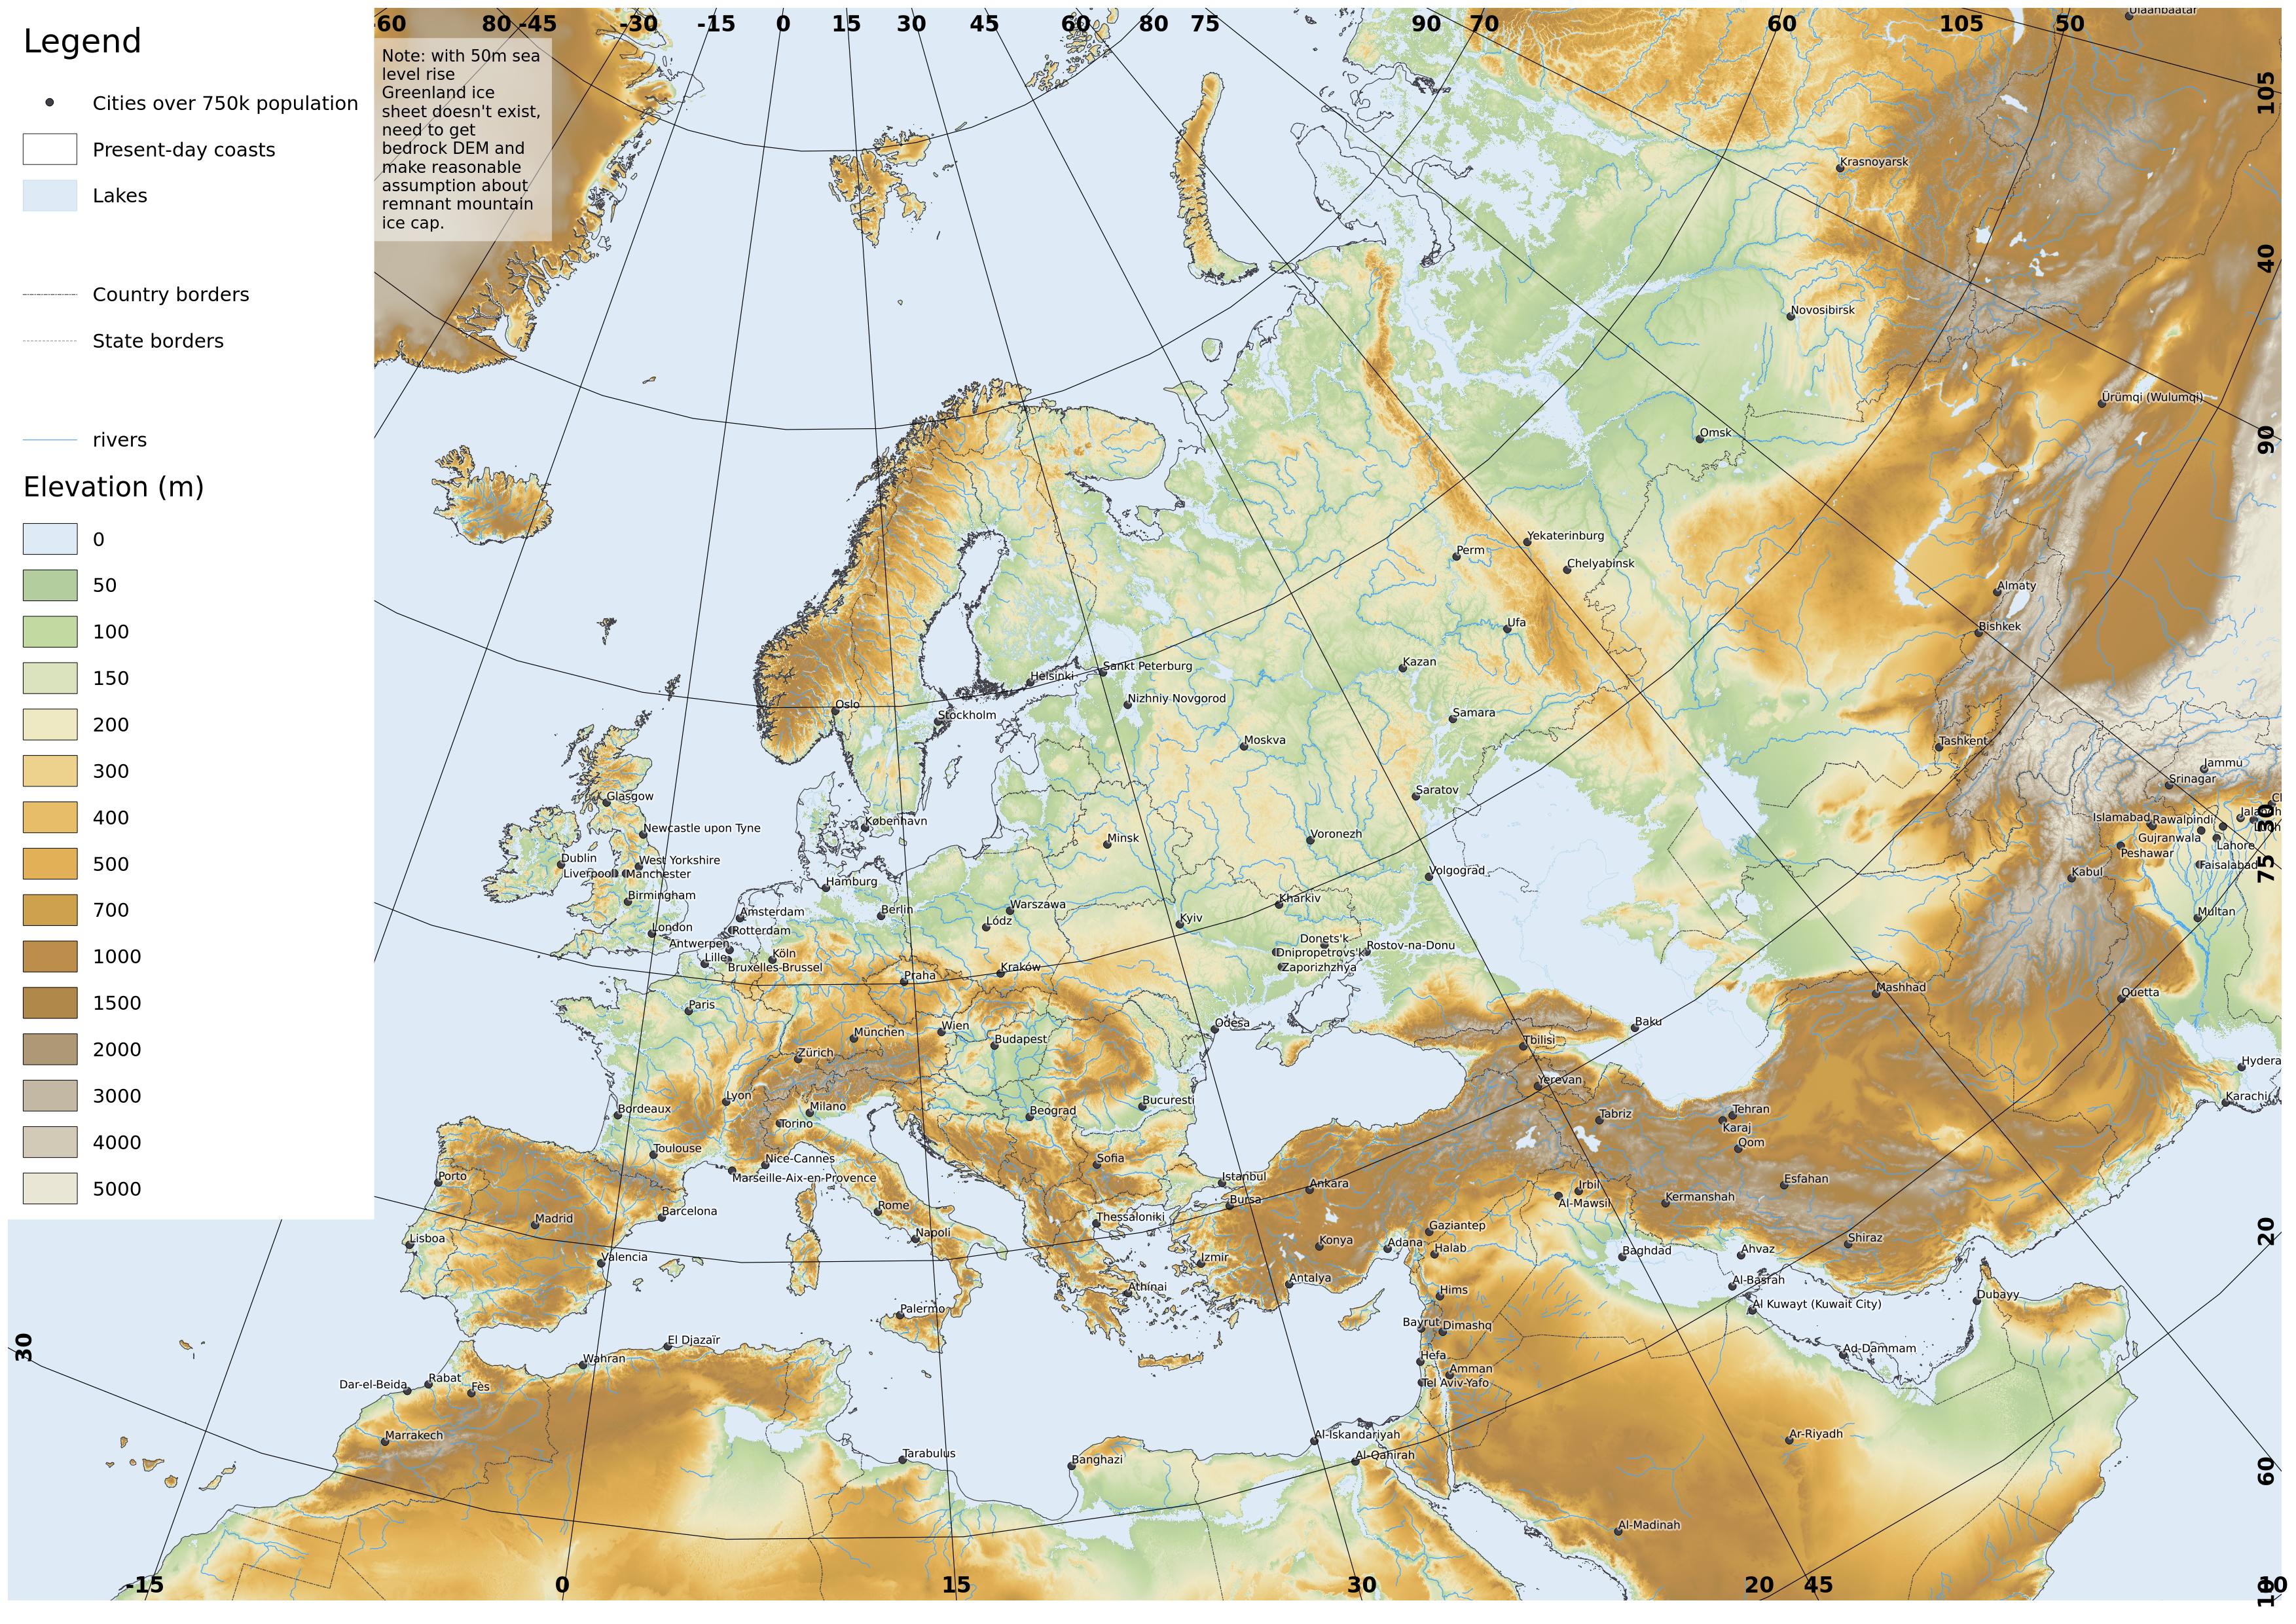
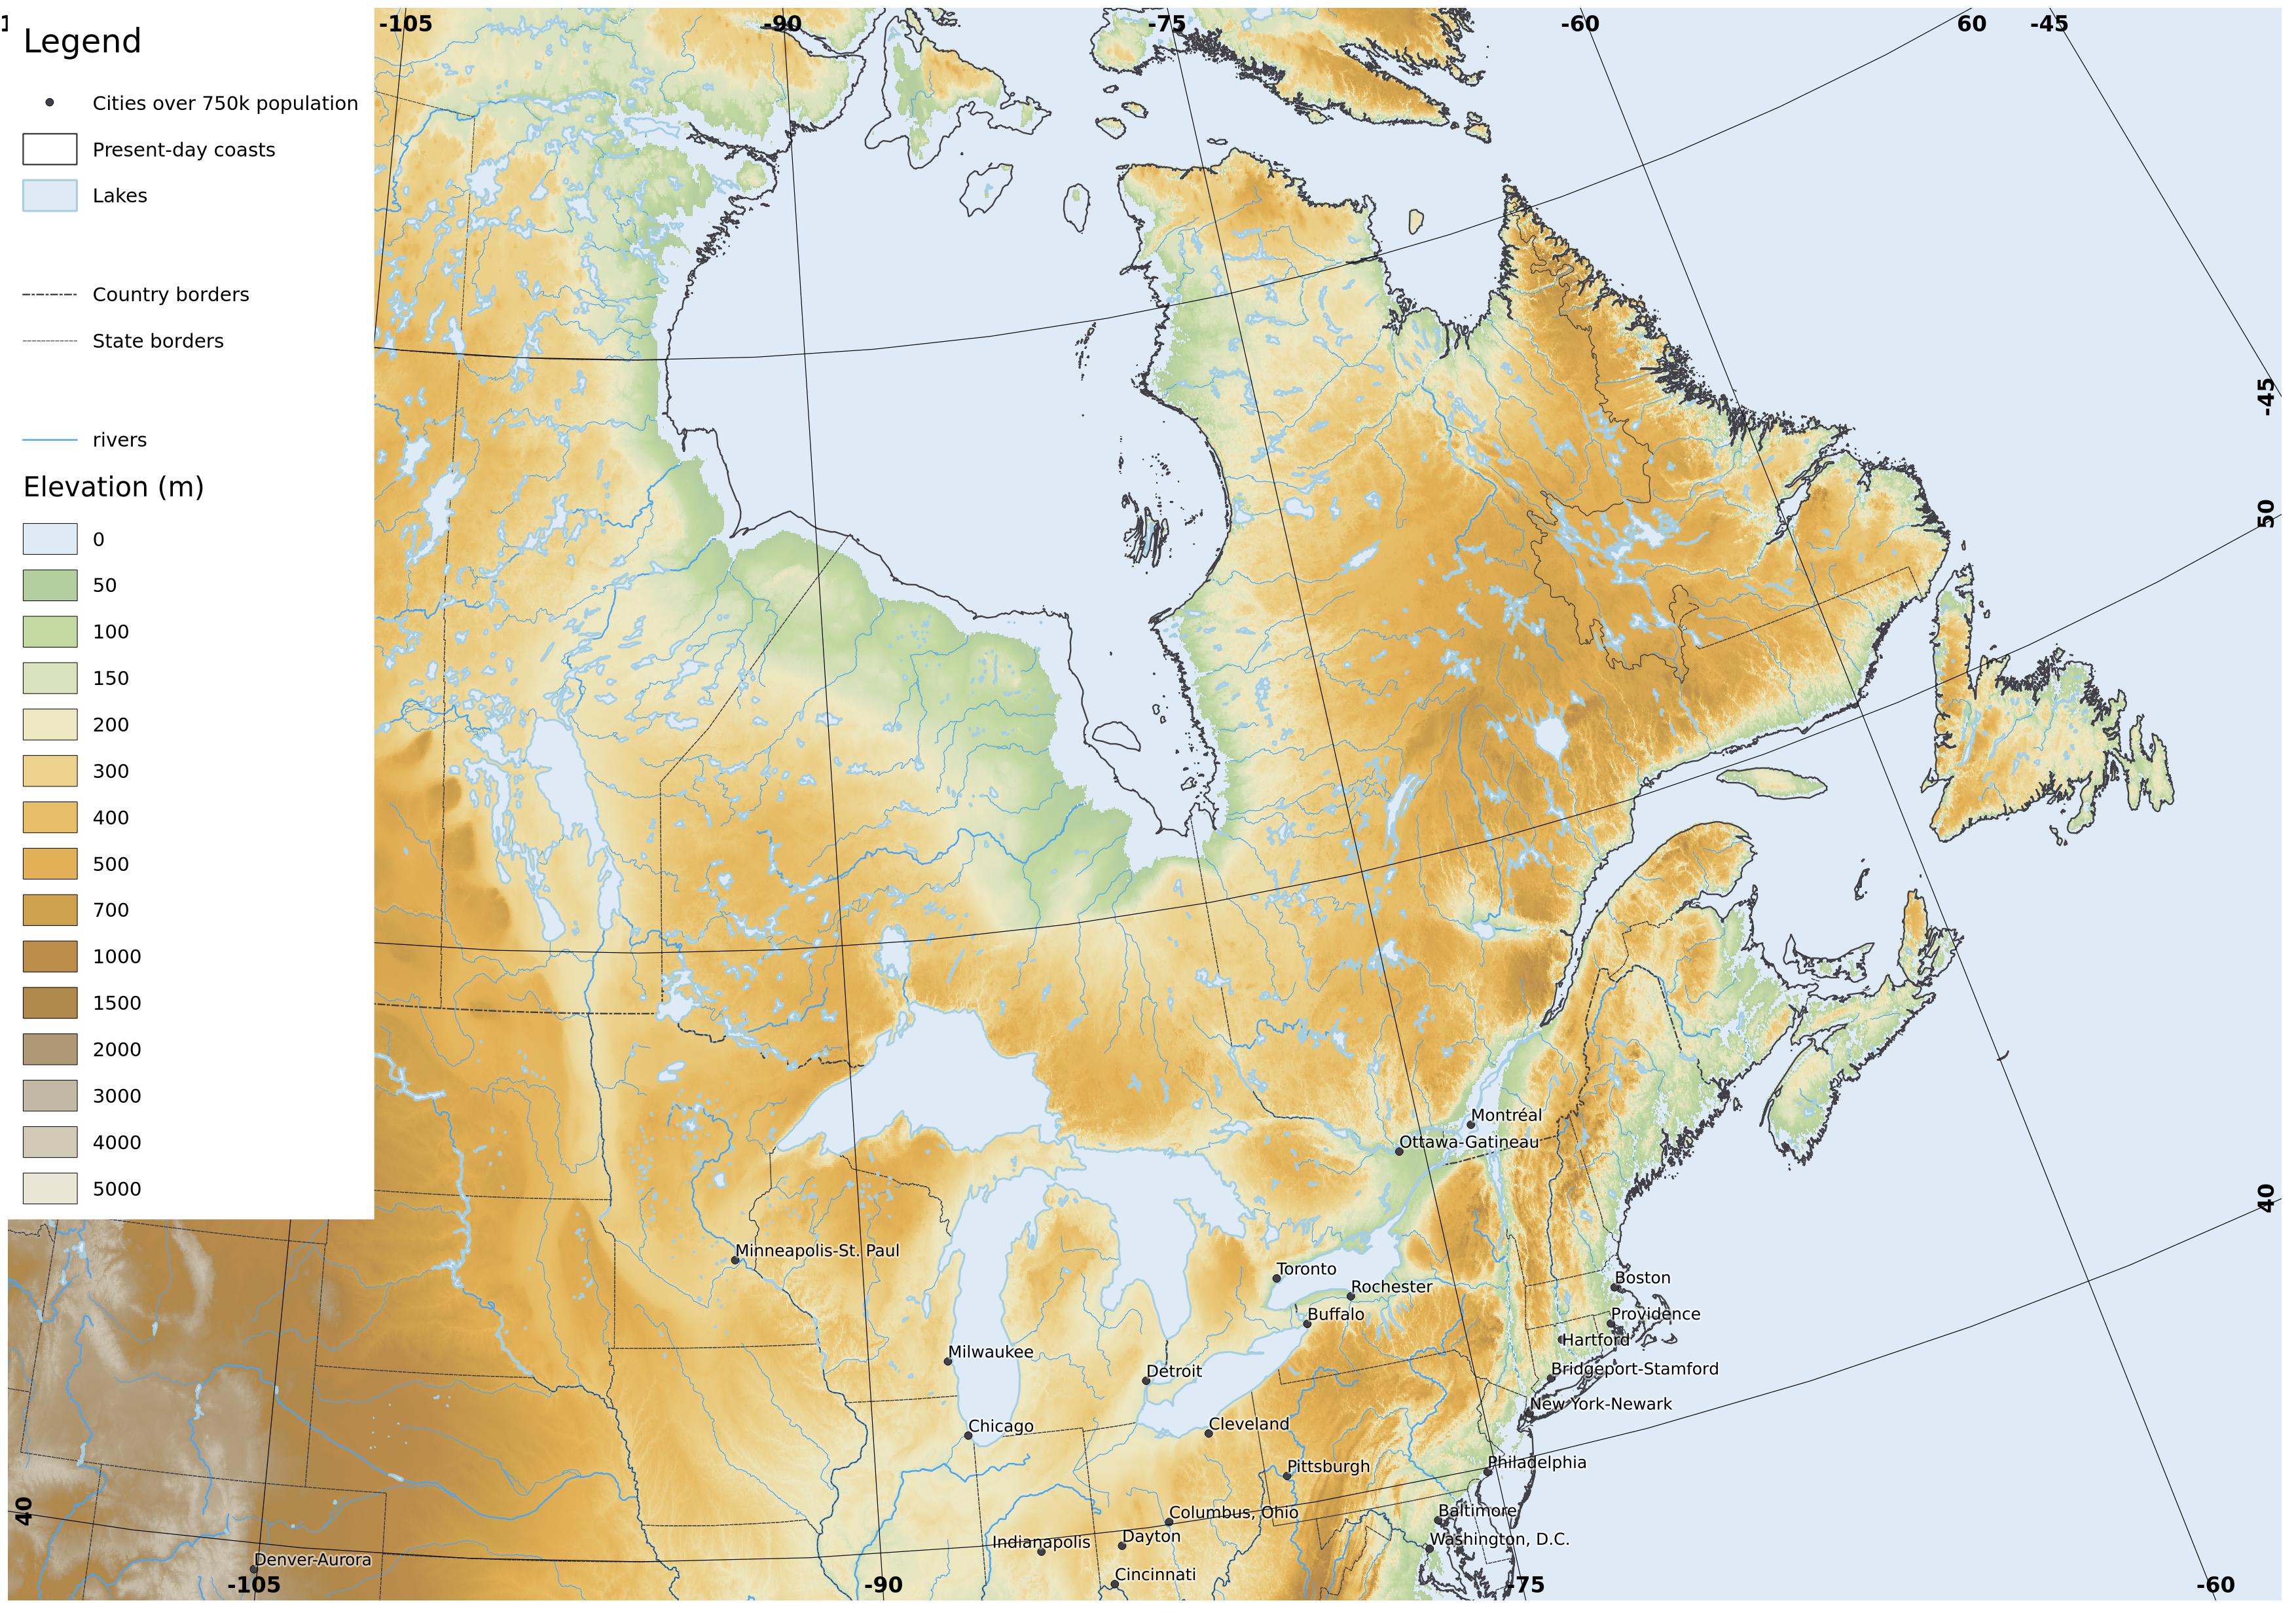
I have also used the ETOPO1 bedrock relief topographic map as a background, which shows the elevation of Greenland without the ice sheet. It is perhaps a century or two too early to assume complete deglaciation of Greenland. The portion of Greenland below sea level is not actually connected to the sea here, it would be at a +50 metre sea level as assumed in the 25th century setting of Star's Reach.

Update

I have made some updates based on further descriptions based on John Michael Greer's comments, which account for the states that are divided:

The borders of the Retrotopia nations can be seen by the colours, with present-day US states and counties shown as lines.
The Lakeland Republic is not labelled since the Free City of Chicago label has prevented it from appearing.


In this case the Lakeland Republic label wins out.

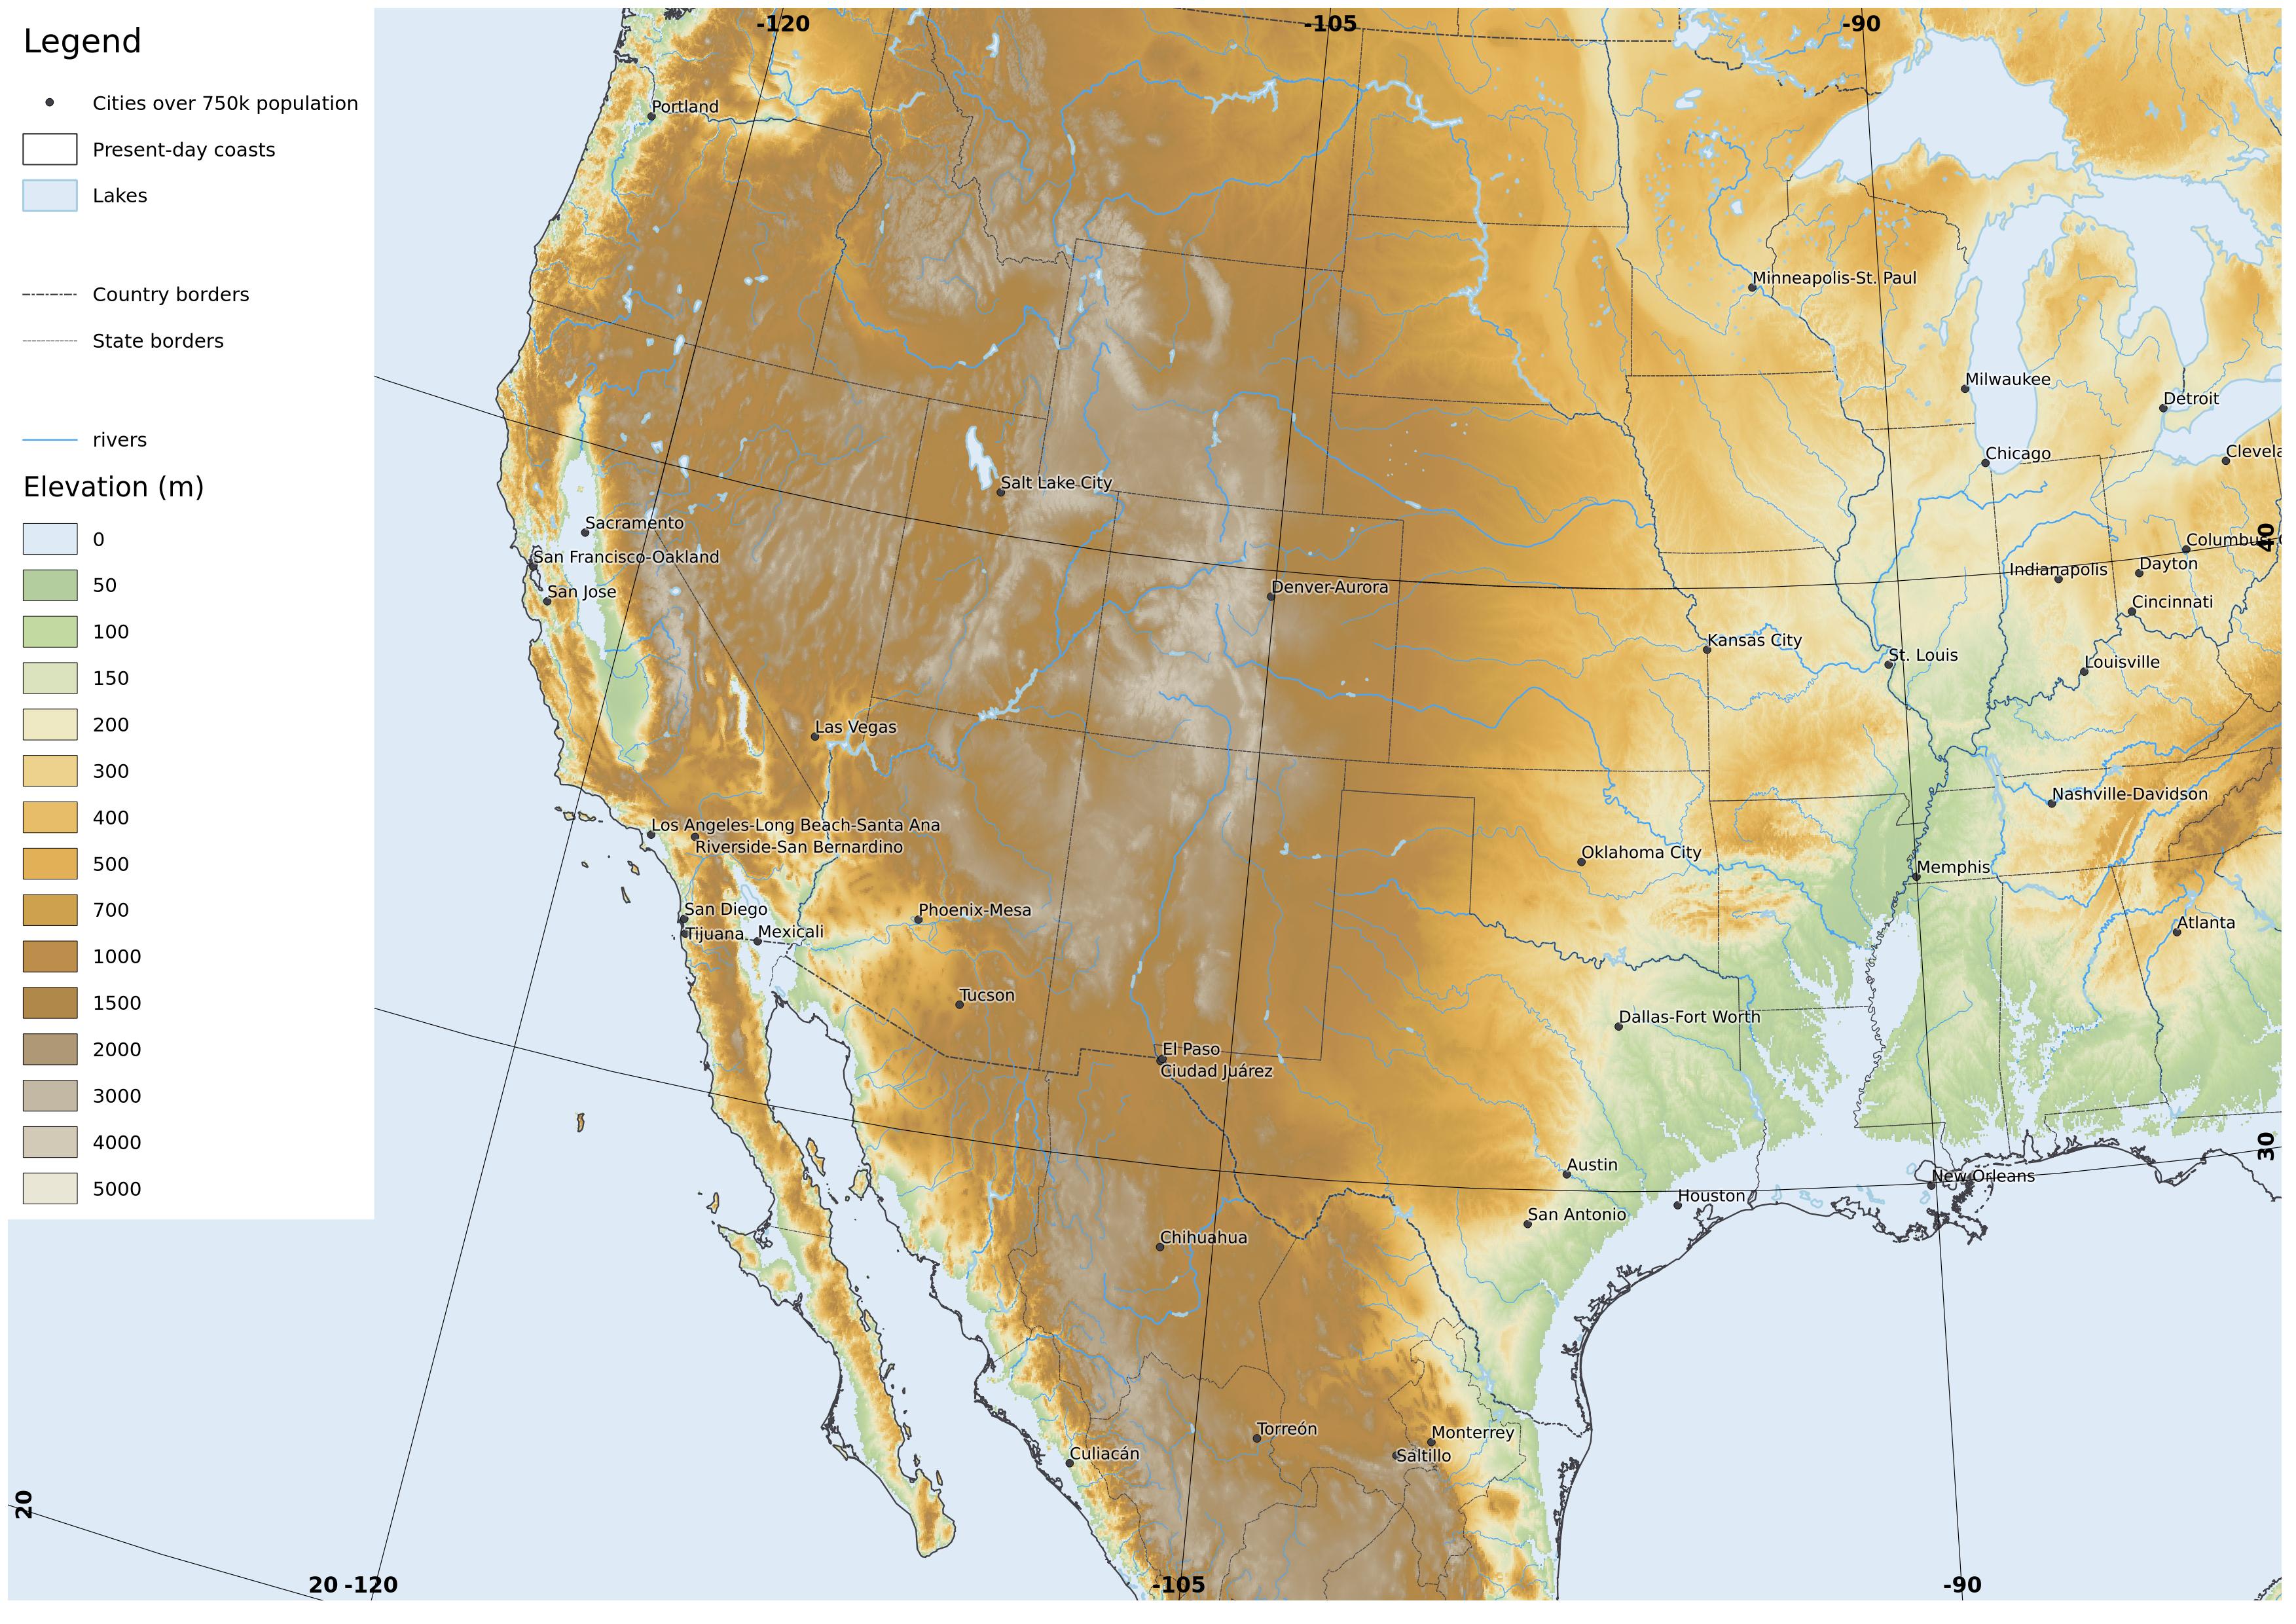
These are the borders of the western areas, as far as I understand JMGs comments.


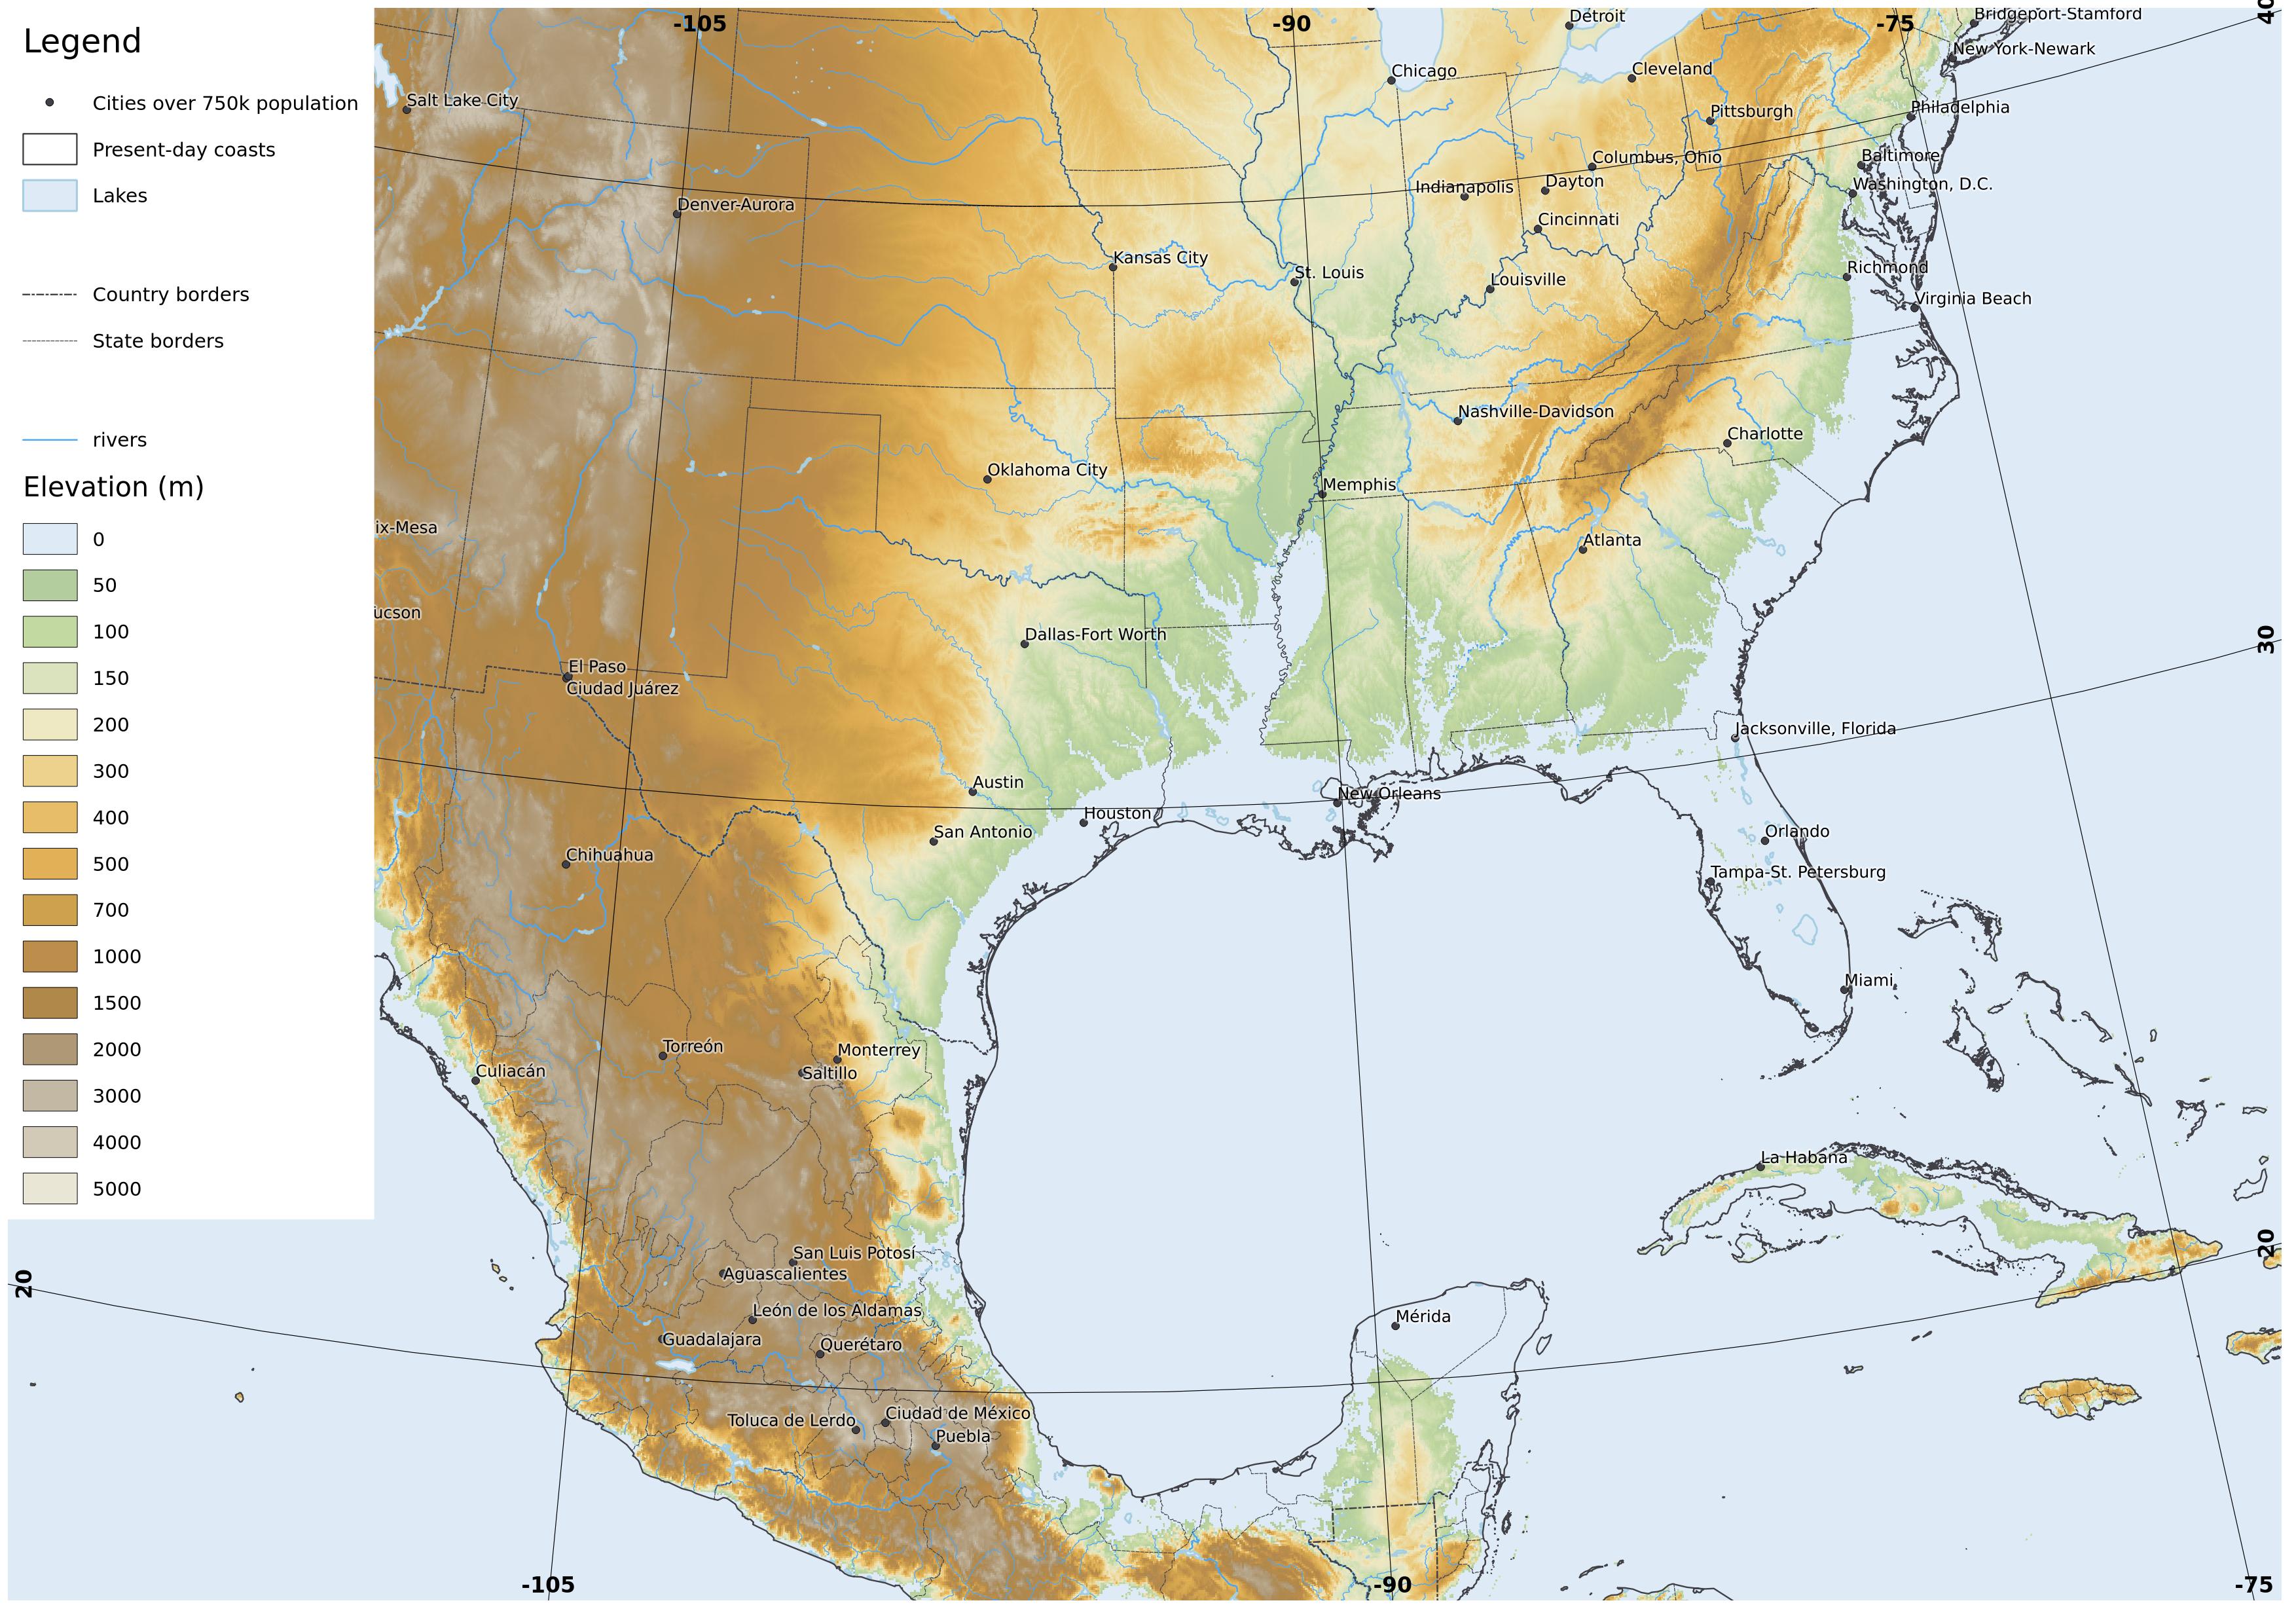
Close-up of the north-east former USA and adjacent part of Canada.
Black and white version.


The shapefile itself containing all of the Retrotopia nations in North America I have made available here.

It is also available as a KML file suitable for use with Google Earth.

Showing 2 meters of sea level rise in blue, with 2-4 metres shaded in lighter blue.

Tuesday, 22 September 2015

The Meriga Project - British Isles

Since I have the 1 arcsec SRTM data ready to go for the British Isles, I thought I'd make a more detailed map for the Meriga Project shared-world speculative fiction anthology for the British Isles. See my last post for an explanation.

OS grid ref projection. 1:3million if printed at A3. full-size version

OS grid ref projection. 1:1.5million if printed at A3. full-size version


Some more detailed maps

I have rendered some more detailed maps at a scale of 1:500000 at A3, of certain areas, which should now cover most of England and Wales, though I have not yet done Scotland and Ireland.

OS grid ref projection. 1:500000 if printed at A3. The England-Scotland border now has a substantial inlet along the Tweed. The Tyne also reaches far inland. full-size version

OS grid ref projection. 1:500000 if printed at A3. Substantial flooding in the Vale of York results in the North York Moors now being an island, with other islands forming the remnants of Lincolnshire. full-size version
OS grid ref projection. 1:500000 if printed at A3. The overland routes linking the expanded seas are now rather shortened. full-size version
OS grid ref projection. 1:500000 if printed at A3. Nottingham, Derby and Loughborough are now seaside towns. full-size version

OS grid ref projection. 1:500000 if printed at A3. The Anglian Isles are inhabited by people making the most of the declining land area. full-size version
OS grid ref projection. 1:500000 if printed at A3. Perhaps central London was drowned catastrophically after the Thames Barrier (or its successor) failed. The technological limitations of this age make underwater salvage risky, but rewarding... full-size version
OS grid ref projection. 1:500000 if printed at A3. full-size version


OS grid ref projection. 1:500000 if printed at A3. Devon and Cornwall now have a much thinner connection to the 'mainland' after the Somerset Levels and the Exe valley sank under the rising seas. Cornwall has a maze of drowned river valleys and is inhabited by two distinct cultural groups, firstly semi-nomadic people travelling in small boats and secondly the upland agricultural settlements. West Penwith is now an island separated by a strait since sea levels were 30m above the pre-industrial level.  full-size version
OS grid ref projection. 1:500000 if printed at A3. Wales is now more deeply incised by river estuaries, with much of Anglesey underwater.  full-size version

OS grid ref projection. 1:500000 if printed at A3. Similarly to the Cornish coast, some parts of Wales have a maze of islands and small river valleys inhabited by the nomadic boat people.  full-size version

Monday, 21 September 2015

The Meriga Project - summary maps

The blogger and author John Michael Greer wrote the book Star's Reach set centuries after the decline of industrial civilisation in the wake of resource depletion and climate change.
He is now looking for stories for a shared-world anthology set in the same world as Star's Reach, the Meriga Project. In the 25th century, the Greenland ice cap and most of Antarctic ice have melted leaving sea level 50m higher than at present. It is possible to view the effect of this at websites like flood.firetree.net.

I thought it worthwhile however to make my own maps of this world in QGIS. I have used the CleanTopo2 digital elevation model. For reference I mark present day coastlines and borders from the Global Self-consistent, Hierarchical, High-resolution Geography Database (NOAA) and the locations of major urban areas >750k inhabitants, from Nordpil (based on data from the UN Population Division).

I have used an Equidistant Conic Projection for the continental scale ones, and Albers Equal Area Projection for the more close-up ones. Most of the maps have a scale of 1:30 million if printed at A4. I link to full-size JPGs of the maps at my own website.

I have not included Antarctica so far, I may do so later if I get hold of a decent bedrock DEM and make some reasonable assumptions about remnant ice sheets at this point.

The northern part of N America, comprising present-day USA, Canada and Greenland. full-size version
The former USA and Central America. full-size version
South America. full-size version
North Africa. The Jordan valley and Dead Sea basin is not in fact flooded, since 50m sea level rise is not enough to make the connection from the Mediterranean. full-size version
Southern Africa. full-size version
Northern Asia. full-size version

SE Asia. full-size version

SW Asia. full-size version

Australasia. Note the sea does not actually flood the Lake Eyre basin in Australia (link). full-size version


Europe. The Jordan valley and Dead Sea basin is not in fact flooded, since 50m sea level rise is not enough to make the connection from the Mediterranean. full-size version
A closer view of eastern Canada and NE USA. This has a different projection which if I remember rightly was Albers Equal Area Conic. full-size version

SW USA. full-size version
SE USA. full-size version
N Europe. full-size version


S Europe. full-size version